Seaborn tsplot() in Python

The Seaborn library, a popular data visualization tool for Python, has undergone significant changes in recent versions. One notable modification is the removal of the tsplot function, which was previously used for visualizing time series data.
If you work on the older version of Seaborn, you can read the last chapters discussing the usage of tsplot().
Deprecation of tsplot
The tsplot function was deprecated in earlier versions of Seaborn and has been completely removed as of version 0.10.0, released in January 2020. This function was part of the seaborn.timeseries module, which has also been eliminated from the library.
Reasons for Removal
The decision to remove tsplot was made because its functionality was limited and often not as useful as it could be. The Seaborn developers recognized that there were more effective ways to visualize time series data and decided to introduce new functions that offer greater flexibility and power.
Replacement: lineplot
The primary replacement for tsplot is the lineplot function, which was introduced in Seaborn version 0.9.0. This new function provides several advantages:
- Greater Flexibility:
lineplotcan handle a wider range of data formats and plotting scenarios. - Improved Aesthetics: It offers better default styling and more customization options.
- Statistical Aggregation:
lineplotcan automatically compute and display confidence intervals and other statistical measures.
Using lineplot
Here’s an example of how to use lineplot:
pythonimport seaborn as sns
import pandas as pd
import numpy as np

# Create sample data
x = np.linspace(0, 15, 31)
data = pd.DataFrame({
    'x': np.tile(x, 10),
    'y': np.sin(x) + np.random.randn(10, 31).flatten(),
    'group': np.repeat(range(10), 31)
})

# Plot using lineplot
sns.lineplot(data=data, x='x', y='y', hue='group')
This code will create a line plot with multiple lines representing different groups, along with confidence intervals.
Archive of tsplot()
The seaborn.tsplot() is a very robust and useful function. It is used when we have the timestamp for the data available. It is used to plot one or more time-series data. The data can be either in the form of a long DataFrame or an N-Dimensional array with dimensions in units and time.
This function can also plot multiple time-series data easily and efficiently. We can customize the final plot using a variety of parameters lie unit, condition, and more. The unit parameter can be a series or DataFrame column used to identify the sampling unit, and the condition parameter can identify the condition of the data or its categories.
We can alter the final line using the color, linewidth parameters to make the plot visually more appealing.
In the following code, we will plot a graph using this function.
import pandas as pd
import matplotlib.pyplot as plt
import seaborn as sns

df = pd.DataFrame(
    {
        "Date": [
            "01012019",
            "01022019",
            "01032019",
            "01042019",
            "01052019",
            "01062019",
            "01072019",
            "01082019",
        ],
        "Price 1": [77, 76, 68, 70, 78, 79, 74, 75],
    }
)
df["Date"] = pd.to_datetime(df["Date"], format="%d%m%Y")

sns.tsplot(data=df["Price 1"], time=df["Date"], color="blue", linewidth=5)
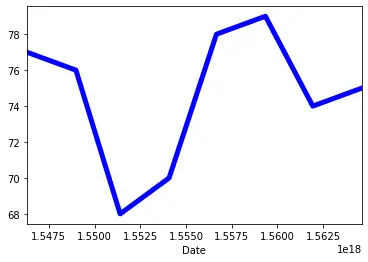
It should be worth knowing that although this function is very powerful for plotting time-series data, it was deprecated in the January 2020 version of the seaborn module. It is advised to use the seaborn.lineplot() function as its alternative.

Manav is a IT Professional who has a lot of experience as a core developer in many live projects. He is an avid learner who enjoys learning new things and sharing his findings whenever possible.
LinkedIn