Matplotlib Tutorial - Place Text in the Plot
-
Matplotlib Axes
Text -
Matplotlib Axes
TextBasic Example -
Matplotlib Axes
TextRotation -
Matplotlib Axes
TextRotation Angle Explanation

We will learn about how to place text in the plot in this tutorial. You would either add text and give that text a coordinate location or you can also add text to a specific plot and maybe draw an arrow that points directly to that plot.
Matplotlib Axes Text
matplotlib.axes.Axes.text(x, y, s, fontdict=None, withdash=False, **kwargs)
Add the text s to the axes at location (x, y) in data coordinates.
Parameters
| Name | Data Type | Description |
|---|---|---|
x, y |
scalars |
The position to place the text |
s |
str |
The annotation text |
fontdict |
dictionary |
A dictionary to override the default text font properties |
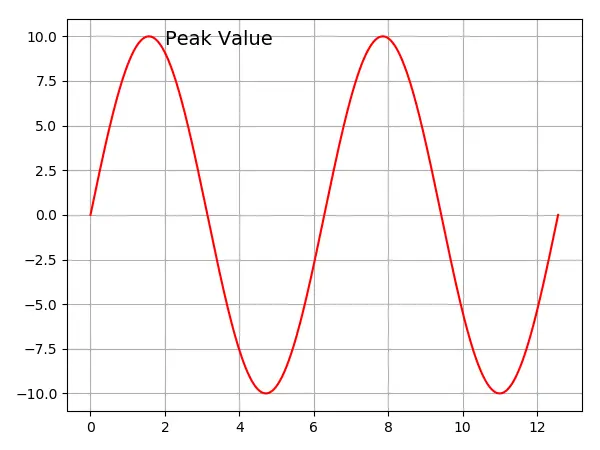
Matplotlib Axes Text Basic Example
# -*- coding: utf-8 -*-
import numpy as np
import matplotlib.pyplot as plt

x = np.linspace(0, 4 * np.pi, 1000)
y = 10 * np.sin(x)

fig, ax = plt.subplots(1, figsize=(6, 4.5))
ax.plot(x, y, "r")
ax.text(2.0, 9.5, "Peak Value", fontsize=14)

ax.grid(True)

plt.show()
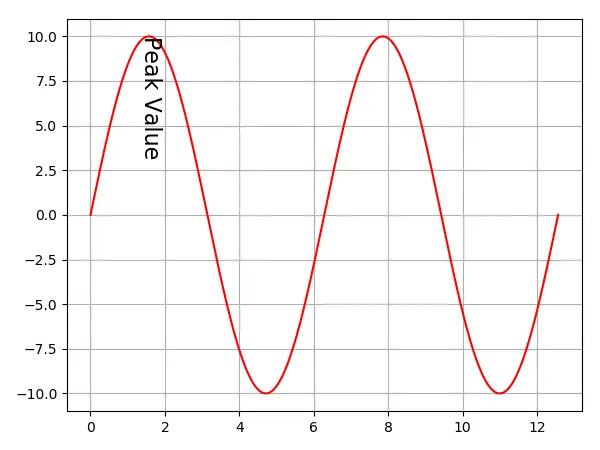
Matplotlib Axes Text Rotation
The axes text has an keyword argument - rotation that specifies the text rotation angle in the plot. The rotation angle is between 0 and 360 (degree).
# -*- coding: utf-8 -*-
import numpy as np
import matplotlib.pyplot as plt

x = np.linspace(0, 4 * np.pi, 1000)
y = 10 * np.sin(x)

fig, ax = plt.subplots(1, figsize=(6, 4.5))
ax.plot(x, y, "r")
ax.text(1.3, 9.0, "Peak Value", fontsize=16, rotation=270)

ax.grid(True)

plt.show()
Matplotlib Axes Text Rotation Angle Explanation
The rotation angle is in the direction of counter clockwise. We make a demo script to illustrate the rotation angle definition.
import matplotlib.pyplot as plt
import numpy as np


def addtext(ax, props):
    for x in range(8):
        angle = 45 * x
        ax.text(0.5 + x, 0.5, "{} degree".format(angle), props, rotation=angle)
        ax.scatter(x + 0.5, 0.5, color="r")

    ax.set_yticks([0, 0.5, 1])
    ax.set_xlim(0, 8)
    ax.grid(True)


# the text bounding box
bbox = {"fc": "0.8", "pad": 0}

fig, axs = plt.subplots(1, 1, figsize=(8, 3))

addtext(axs, {"ha": "center", "va": "center", "bbox": bbox})
axs.set_xticks(np.arange(0, 8.1, 0.5), [])
axs.set_ylabel("center / center")

plt.show()
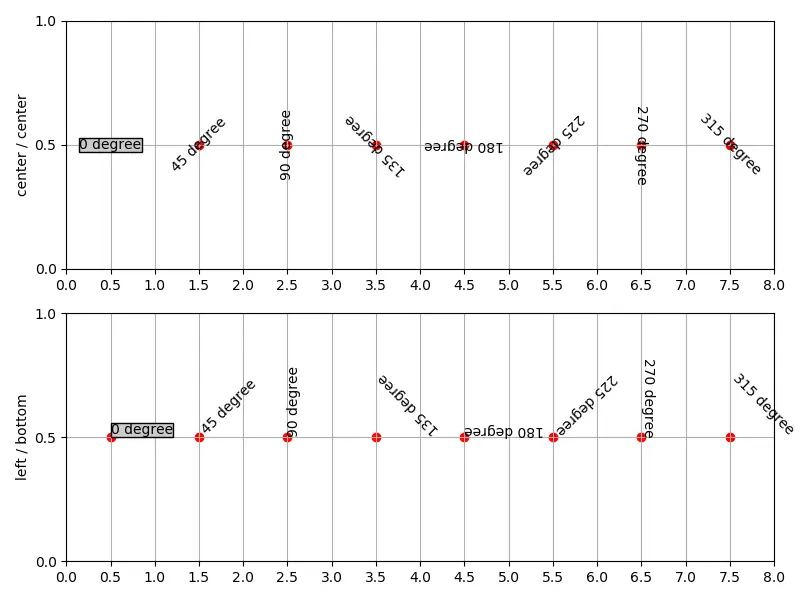
The text is aligned by its bounding box that is the rectangular box surrounding the text rectangle. The text will be firstly rotated and then aligned. Basically, the text is centered at (x, y) location, rotated around this point, and then aligned according to the bounding box of the rotated text.
So if you specify left, bottom alignment, the bottom left of the bounding box of the rotated text will be at the (x, y) coordinate of the text.

Founder of DelftStack.com. Jinku has worked in the robotics and automotive industries for over 8 years. He sharpened his coding skills when he needed to do the automatic testing, data collection from remote servers and report creation from the endurance test. He is from an electrical/electronics engineering background but has expanded his interest to embedded electronics, embedded programming and front-/back-end programming.
LinkedIn Facebook