R의 랜덤 포레스트
Random Forest 접근 방식에서는 많은 수의 결정 트리가 생성됩니다. 이 튜토리얼은 R에서 랜덤 포레스트 접근법을 적용하는 방법을 보여줍니다.
R의 랜덤 포레스트
Random Forest 접근 방식에서는 많은 수의 결정 트리가 생성됩니다. 많은 관찰이 의사 결정 트리에 입력되며 가장 일반적인 결과가 최종 결과로 사용됩니다.
그런 다음 모든 분류 모델에 대해 과반수 투표를 하기 위해 새로운 관찰이 모든 의사 결정 트리로 전송됩니다. 트리 구축 중에 사용되지 않은 사례에 대해 OOB(out-of-bag) 오류 추정이 이루어집니다.
iris 데이터 세트를 사용하고 랜덤 포레스트 접근 방식을 적용해 보겠습니다. R에서 랜덤 포레스트를 구현하려면 caTools 및 randomForest를 설치해야 합니다.
install.packages("caTools")
install.packages("randomForest")
패키지가 설치되면 패키지를 로드하고 랜덤 포레스트 방식을 시작할 수 있습니다. 예를 참조하십시오:
# Loading package
library(caTools)
library(randomForest)

# Split the data in train data and test data with ratio 0.8
split_data <- sample.split(iris, SplitRatio = 0.8)
split_data

train_data <- subset(iris, split == "TRUE")
test_data <- subset(iris, split == "FALSE")

# Fit the random Forest to the train dataset
set.seed(120) # Setting seed
classifier_Random_Forest = randomForest(x = train_data[-4],
                             y = train_data$Species,
                             ntree = 400)

classifier_Random_Forest
위의 코드는 홍채 데이터를 0.8의 비율로 분할한 다음 훈련 및 테스트 데이터를 생성합니다. 마지막으로 400개의 트리로 랜덤 포레스트 접근 방식을 적용합니다. 출력은 다음과 같습니다.
Call:
 randomForest(x = train_data[-4], y = train_data$Species, ntree = 400)
               Type of random forest: classification
                     Number of trees: 400
No. of variables tried at each split: 2

        OOB estimate of  error rate: 0%
Confusion matrix:
           setosa versicolor virginica class.error
setosa         30          0         0           0
versicolor      0         30         0           0
virginica       0          0        30           0
랜덤 포레스트 모델이 적합해지면 테스트 세트 결과를 예측하고 혼동 행렬을 보고 모델 그래프를 그릴 수 있습니다. 아래 코드를 참조하십시오.
# Predict the Test set result
y_pred = predict(classifier_RF, newdata = test_data[-4])
# The Confusion Matrix
conf_matrix = table(test_data[, 4], y_pred)
conf_matrix
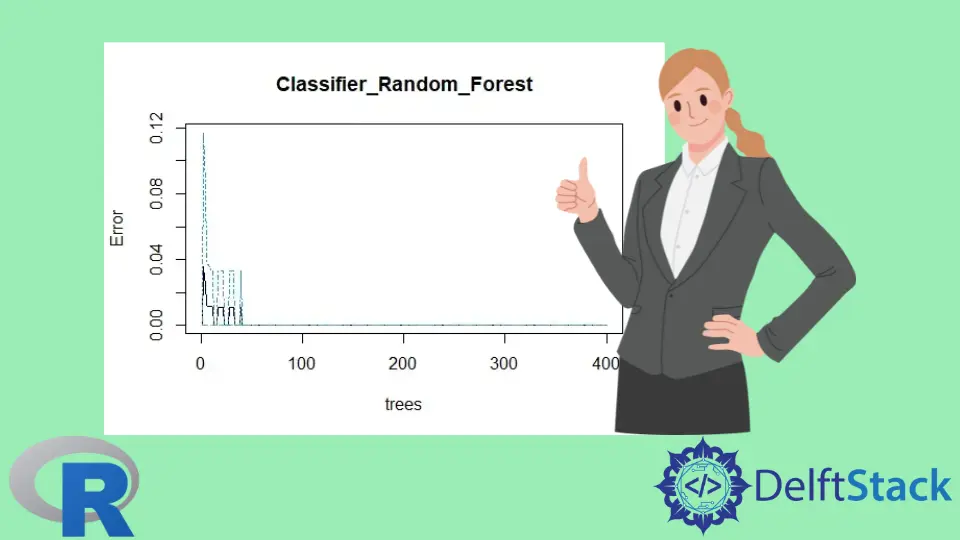
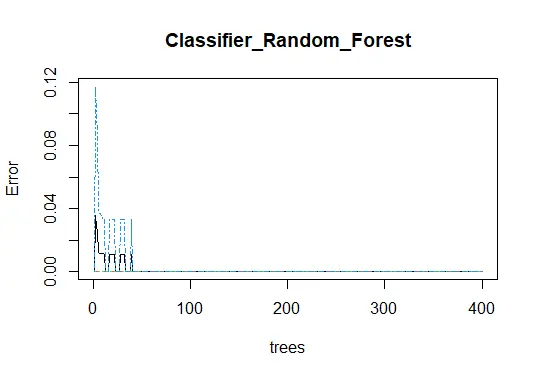
# Plot the random forest model
plot(classifier_Random_Forest)
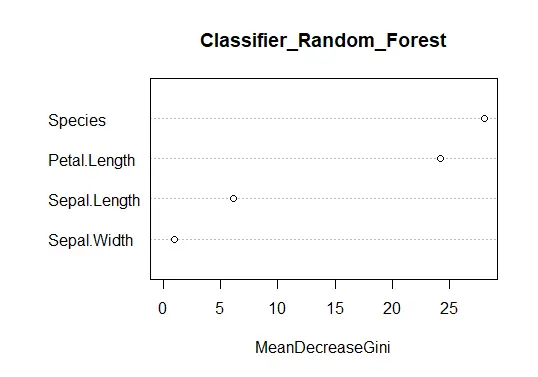
# The importance plot
importance(classifier_Random_Forest)
# The Variable importance plot
varImpPlot(classifier_Random_Forest)
위의 코드는 테스트 세트 결과를 예측한 다음 혼동 행렬을 보여줍니다. 마지막으로 랜덤 포레스트 모델 플롯, 중요도 및 변수 중요도 플롯을 보여줍니다.
출력 참조:
> conf_matrix
     y_pred
      setosa versicolor virginica
  0.1      1          0         0
  0.2     10          0         0
  0.3      3          0         0
  0.4      4          0         0
  0.5      1          0         0
  0.6      1          0         0
  1        0          2         0
  1.1      0          1         0
  1.2      0          1         0
  1.3      0          5         0
  1.4      0          3         0
  1.5      0          6         1
  1.6      0          1         1
  1.7      0          1         0
  1.8      0          2         4
  1.9      0          0         3
  2        0          0         3
  2.1      0          0         1
  2.3      0          0         4
  2.4      0          0         1
랜덤 포레스트 모델 플롯:
랜덤 포레스트 모델의 중요성:
             MeanDecreaseGini
Sepal.Length        6.1736467
Sepal.Width         0.9664428
Petal.Length       24.1454822
Species            28.0489838
Variable Importance 플롯:

Sheeraz is a Doctorate fellow in Computer Science at Northwestern Polytechnical University, Xian, China. He has 7 years of Software Development experience in AI, Web, Database, and Desktop technologies. He writes tutorials in Java, PHP, Python, GoLang, R, etc., to help beginners learn the field of Computer Science.
LinkedIn Facebook