HOWTO · R
R의 PCH
이 튜토리얼은 R에서 pch를 사용하는 방법을 보여줍니다.
이 튜토리얼은 R에서 pch의 사용을 보여줍니다.
R의 pch
plot character로 약칭되는 pch는 문자를 설정하는 데 사용되는 표준 인수이며 다른 R 함수에서 플롯됩니다. pch는 플롯에 추가된 설명 기호로 정의할 수도 있습니다. 이 설명 텍스트에는 범례, 축 레이블 또는 제목이 포함됩니다.
pch는 특정 항목을 설명하는 플롯에 추가하려는 기호입니다. 다음은 해당 값이 포함된 pch 기호 목록입니다.
pch = 0 square
pch = 1 circle
pch = 2 point up triangle
pch = 3 plus
pch = 4 cross
pch = 5 diamond
pch = 6 point-down triangle
pch = 7 square cross
pch = 8 star
pch = 9 diamond plus
pch = 10 circle plus
pch = 11 up and down triangles
pch = 12 square plus
pch = 13 circle cross
pch = 14 square and down triangle
pch = 15 filled square
pch = 16 filled circle
pch = 17 point-up filled triangle
pch = 18 filled diamond
pch = 19 solid circle
pch = 20 bullet (smaller circle)
pch = 21 filled circle blue
pch = 22 filled square blue
pch = 23 filled diamond blue
pch = 24 filled triangle point-up blue
pch = 25 filled triangle point down blue
pch는 범례에 대한 인수로 전달됩니다. pch 메소드는 위 목록의 값을 포함합니다. pch에 대한 예를 살펴보겠습니다.
#data
set.seed(1234)
delftstack <- data.frame(x=runif(10),y=runif(10),
                 color=rep(c("lightblue","red"),5),
                 background=rep(c("red", "lightblue"),5),
                 shape=rep(c(21,24),5),stringsAsFactors = FALSE)

#plot
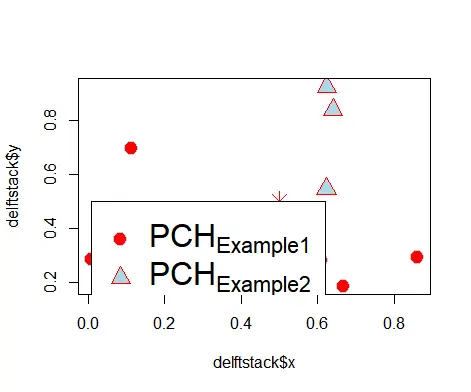
plot(delftstack$x,delftstack$y,col=delftstack$color,bg=delftstack$background,pch=delftstack$shape,cex=2)
points(x=0.5,y=0.5,pch=8,col="red",cex=2)

#add a legend, pt.bg is needed to fill in the background of the shape
legend(0.01,0.5,
       legend = c(expression("PCH"["Example1"]),
                  expression("PCH"["Example2"]),
                  expression("PCH"["Example"])),
       pch = c(21,24,8),
       col = c("lightblue","red","red"),
       pt.bg = c("red","lightblue"),
       cex=2)
위의 코드는 데이터 프레임의 데이터를 플로팅한 다음 범례에서 pch를 포함하는 몇 가지 특성을 적용하려고 시도합니다. 출력을 참조하십시오.