Matplotlib で凡例をプロットの外側に配置する方法
胡金庫
2023年1月30日
Matplotlib
Matplotlib Legend

凡例は、bbox_to_anchor を使用して Matplotlib のプロットの外側に配置できます。bbox は、凡例を収容する bounding box を意味します。
plt.legend(bbox_to_anchor=(1.05, 1))
凡例は、座標軸の (1.05, 1) の位置に配置されます。(0, 0) は左下隅、(1.0, 1.0) は軸座標の右上隅です。
凡例のバウンディングボックスの実際のサイズと位置は、plt.legend の bbox_to_anchor と loc の 4 タプルパラメーターで定義されます。
plt.legend(bbox_to_anchor=(x0, y0, width, height), loc=)
width と height は凡例ボックスの幅と高さで、(x0, y0) はバウンディングボックスの loc の座標です。
loc の値は、次のような関係を持つ数値または文字列にすることができます。
| ロケーション番号 | 位置文字列 |
|---|---|
| 0 | best |
| 1 | upper right |
| 2 | upper left |
| 3 | lower left |
| 4 | lower right |
| 5 | right |
| 6 | center left |
| 7 | center right |
| 8 | lower center |
| 9 | upper center |
| 10 | center |
plt.legend(bbox_to_anchor=(1.05, 1.0, 0.3, 0.2), loc="upper left")
上記のコードは、凡例ボックスが幅 0.3 および高さ 0.2 の軸座標 (1.05, 1.0) に配置されることを意味します。ここで、(1.05, 1.0) は上部の座標です凡例の境界ボックスの左隅。
bbox_to_anchor の例
import matplotlib.pyplot as plt
import numpy as np

x = np.linspace(0, 10, 100)

plt.plot(x, np.sin(x), label="sin(x)")
plt.plot(x, np.cos(x), label="cos(x)")

plt.legend(bbox_to_anchor=(1.05, 1.0), loc="upper left")
plt.tight_layout()
plt.show()
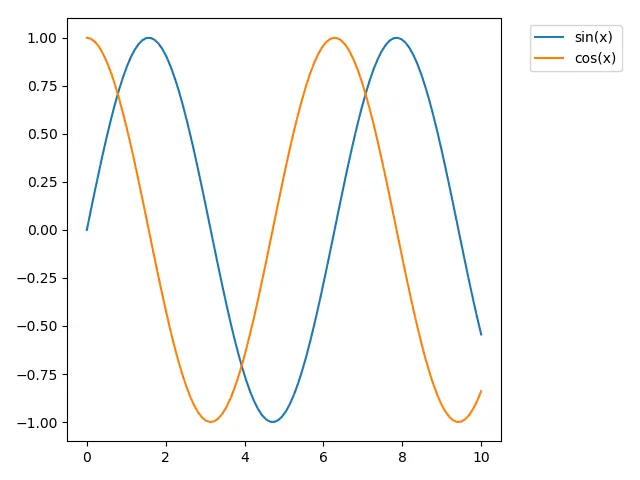
plt.tight_layout() はサブプロットを図にうまく適合させます。
tight_layout() が呼び出されない場合、凡例ボックスはトリミングされます。
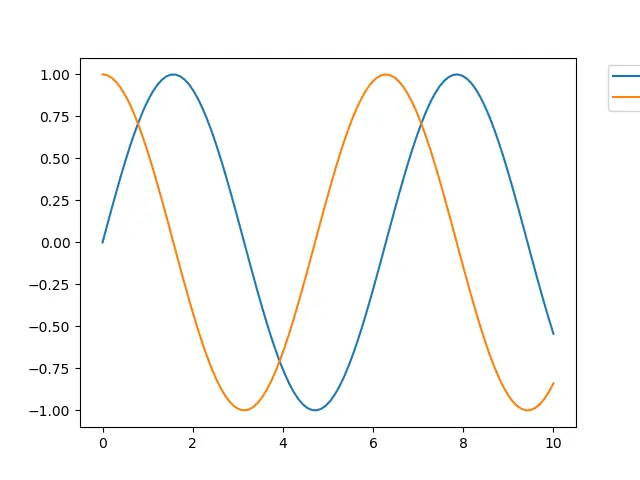
凡例ボックスがトリミングされないようにするための bbox_extra_artists および bbox_inches
import matplotlib.pyplot as plt
import numpy as np

x = np.linspace(0, 10, 100)

plt.plot(x, np.sin(x), label="sin(x)")
plt.plot(x, np.cos(x), label="cos(x)")

lg = plt.legend(bbox_to_anchor=(1.05, 1.0), loc="upper left")

plt.savefig(
    "example.png", dpi=300, format="png", bbox_extra_artists=(lg,), bbox_inches="tight"
)
bbox_extra_artists は、タイトな bbox を計算するときに考慮される Artist のリストを指定します。
bbox_inches が tight に設定されている場合、Figure のタイトな bbox がわかります。
チュートリアルを楽しんでいますか? <a href="https://www.youtube.com/@delftstack/?sub_confirmation=1" style="color: #a94442; font-weight: bold; text-decoration: underline;">DelftStackをチャンネル登録</a> して、高品質な動画ガイドをさらに制作するためのサポートをお願いします。 Subscribe
著者: 胡金庫
