Matplotlib PyCharm
-
Install
Matplotlibin PyCharm -
Manually Install
Matplotlibin PyCharm -
Types of Plots With
Matplotlib - Conclusion
Matplotlib is a Python script module used to make 2D graphs and plots. With features to control line styles, font attributes, formatting axes, and other features.
It offers various graphs and plots, including error charts, bar charts, power spectra, and histograms.
Matplotlib is a multi-platform data visualization package created to deal with the larger SciPy stack and is based on NumPy arrays. One of the visualization’s biggest advantages is that it gives us visual access to vast volumes of data in forms that are simple to understand.
Install Matplotlib in PyCharm
To install the Matplotlib module in PyCharm IDE, run the following code in the IDE’s terminal.
C:\Users\Your Name>pip install matplotlib
Then import the Matplotlib module into your program in PyCharm IDE using the import keyword.
import matplotlib
Manually Install Matplotlib in PyCharm
To manually install the famous data visualization library matplotlib in your PyCharm IDE, follow the following steps.
-
Go to PyCharm IDE.
-
Create a Python project.
-
Go to
Fileon the top bar and selectProjectfromSettings. -
Click on the
Python Interpreterto reach the package section. -
Click on the
+symbol which indicates that install a new package or library. -
Clicking on the
+symbol will open a new window, now search formatplotliband click on the suggested one. -
Click
Install Package. -
Once installed, you will get the message
package matplotlib installed successfully. -
Now you can import it into your current project using the
importkeyword.
Types of Plots With Matplotlib
As we mentioned above, you can make many different plots and graphs with the help of the Matplotlib library. So, here we are going to discuss some of them.
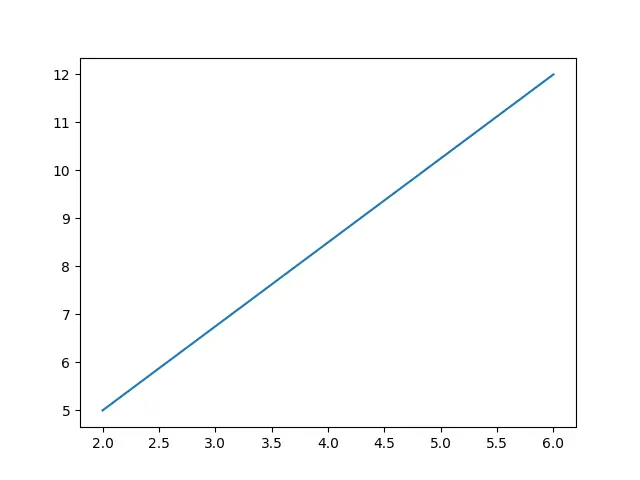
Line Plot With Matplotlib
As its name describes, the line plot forms a straight line on the x and y-axis. You need to insert the parameters in an array form that will create a straight 2D line.
import sys
import matplotlib

# %matplotlib inline

import matplotlib.pyplot as plt
import numpy as np

xpoints = np.array([2, 6])
ypoints = np.array([5, 12])

plt.plot(xpoints, ypoints)
plt.show()
Output:
Matplotlib Marker
A unique method of managing markers in Matplotlib graphs is called Matplotlib Marker. Graphs can be customized using marker functions because they come with various markers and other indicating icons.
The following are a few of the most commonly used markers.
| Markers | Description |
|---|---|
. |
point |
, |
pixel |
o |
circle |
Let’s understand all these with the help of examples.
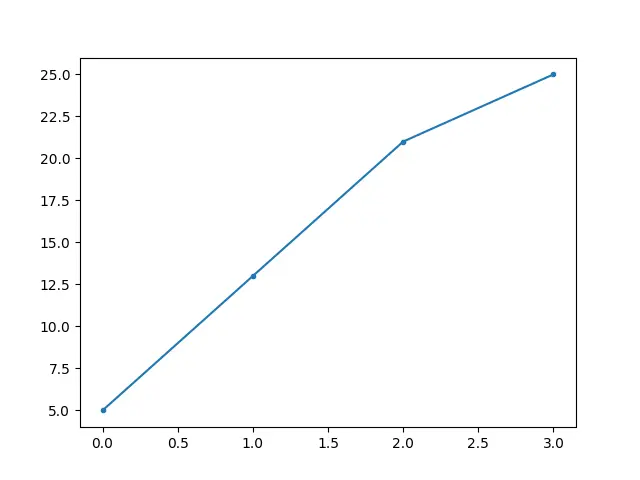
for Point Marker
To form this, we use . here is the code:
import sys
import matplotlib

# %matplotlib inline

import matplotlib.pyplot as plt
import numpy as np

ypoints = np.array([5, 13, 21, 25])

# for point marker

plt.plot(ypoints, marker=".")
plt.show()
Output:
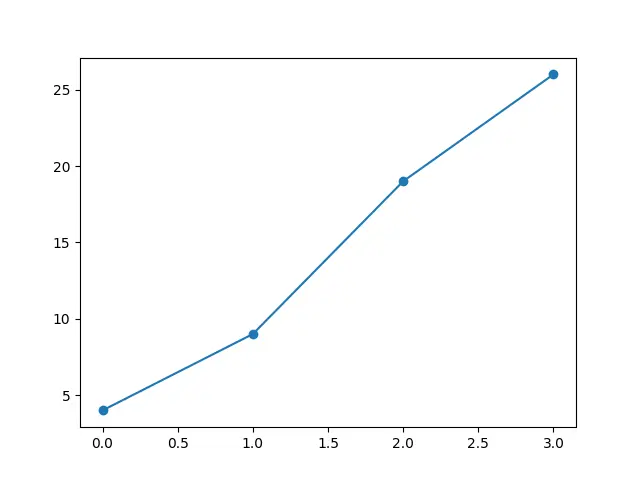
for Circle Marker
Use the following code to make a o (circle) marker:
import sys
import matplotlib

# %matplotlib inline

import matplotlib.pyplot as plt
import numpy as np

ypoints = np.array([4, 9, 19, 26])

# for circle
plt.plot(ypoints, marker="o")
plt.show()
Output:
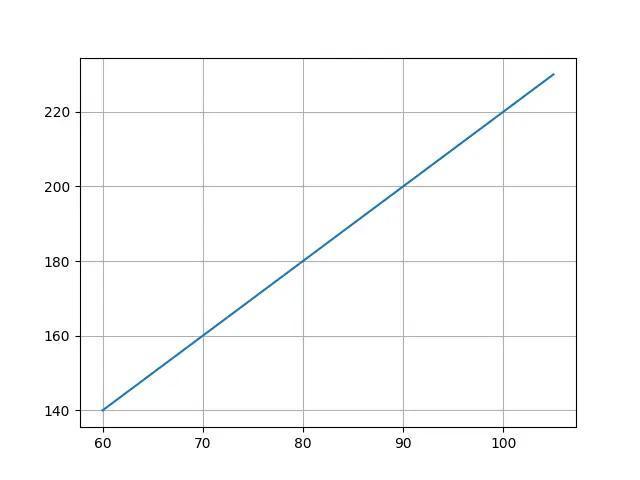
Matplotlib Grid
The grid inside the graphic can be shown or hidden using the axes object’s grid() function.
Following is the code for the Matplotlib grid:
import sys
import matplotlib

# %matplotlib inline

import numpy as np
import matplotlib.pyplot as plt

x = np.array([60, 65, 70, 75, 80, 85, 90, 95, 100, 105])
y = np.array([140, 150, 160, 170, 180, 190, 200, 210, 220, 230])

plt.plot(x, y)

plt.grid()

plt.show()
Output:
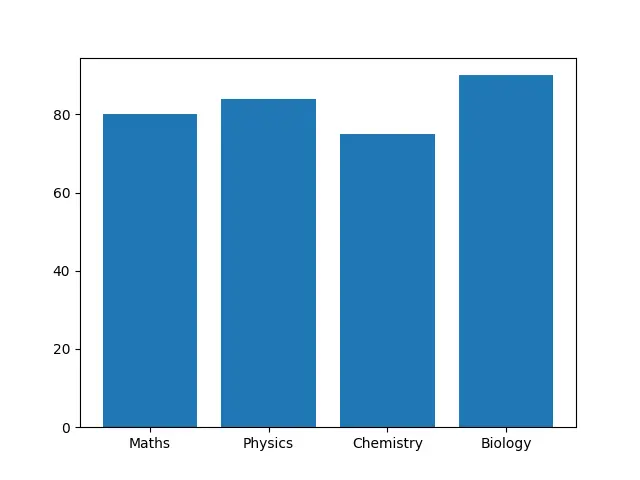
Matplotlib Bar
To show the progress of values of different categories, you can use the bar() function.
import sys
import matplotlib

# %matplotlib inline

import matplotlib.pyplot as plt
import numpy as np

x = np.array(["Maths", "Physics", "Chemistry", "Biology"])
y = np.array([80, 84, 75, 90])

plt.bar(x, y)
plt.show()
Output:
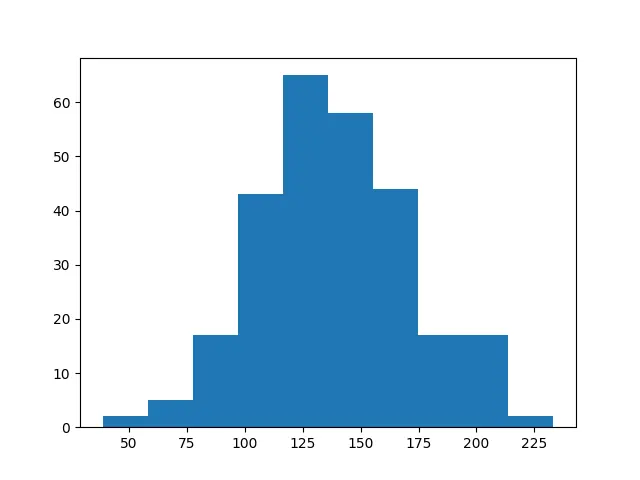
Matplotlib Histogram
The histogram graph explains the frequency distribution in a given interval.
import sys
import matplotlib

# %matplotlib inline

import matplotlib.pyplot as plt
import numpy as np

x = np.random.normal(140, 30, 270)

plt.hist(x)
plt.show()
Output:
Conclusion
Matplotlib creates a 2D graph to visualize the inserted information. In this article, we tried to cover all the main graphs that can be plotted with the help of the Matplotlib module.
The compatibility of Matplotlib with a wide range of operating systems and graphics backends is one of its key advantages. You can rely on Matplotlib to function no matter what operating system you use or the output format you prefer.

Zeeshan is a detail oriented software engineer that helps companies and individuals make their lives and easier with software solutions.
LinkedIn