Seaborn Set_xticklabels 函数
Manav Narula
2021年7月16日
Seaborn
Seaborn Tick
本文将介绍如何控制两个轴上的刻度标签。
例如,请注意下图的问题。
import pandas as pd
import matplotlib.pyplot as plt
import seaborn as sns

df = pd.DataFrame(
    {
        "Date": [
            "01012019",
            "01022019",
            "01032019",
            "01042019",
            "01052019",
            "01062019",
            "01072019",
            "01082019",
        ],
        "Price": [77, 76, 68, 70, 78, 79, 74, 75],
    }
)
df["Date"] = pd.to_datetime(df["Date"], format="%d%m%Y")

plt.figure(figsize=(15, 8))
ax = sns.barplot(x="Date", y="Price", data=df)
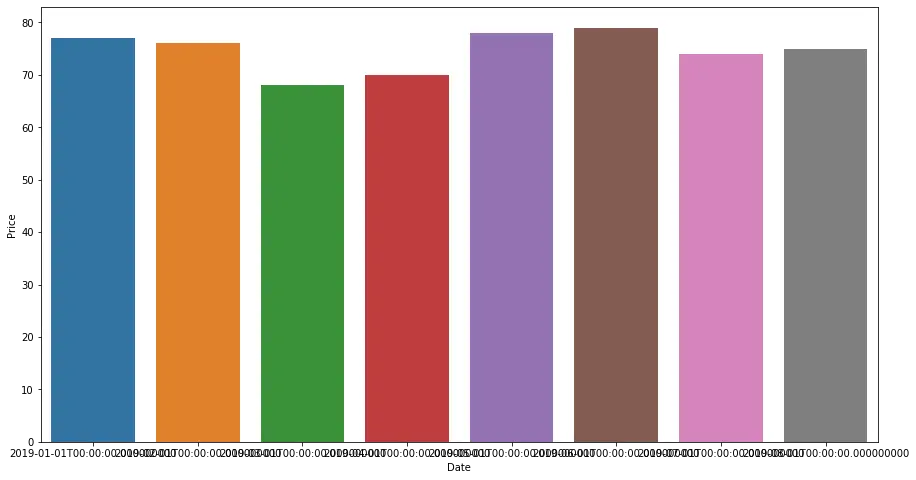
在上图中,整个日期绘制在 x 轴上。但一切都是重叠的,难以阅读。
我们可以使用 set_xticklabels() 函数为 x 轴设置自定义刻度标签。seaborn 图返回一个 matplotlib 轴实例类型对象。我们可以在这个对象上使用这个函数。
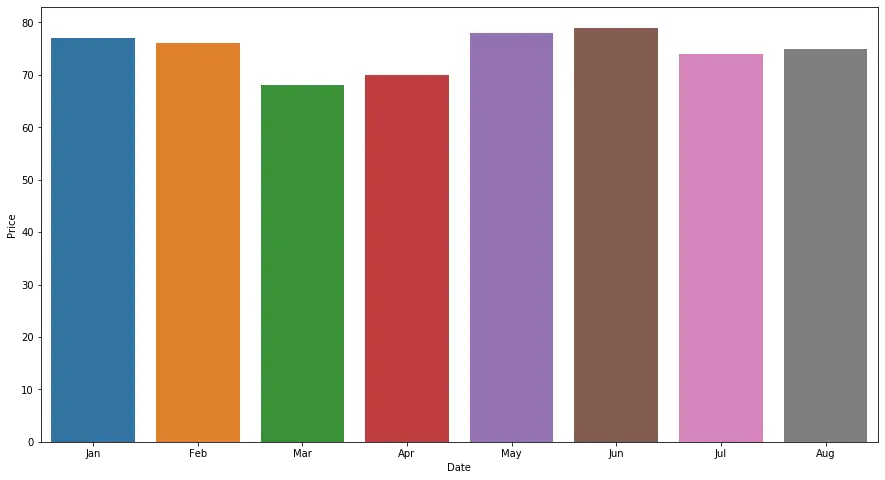
例如,我们可以在上面提到的问题中将标签作为月份名称传递,如下所示。
import pandas as pd
import matplotlib.pyplot as plt
import seaborn as sns

df = pd.DataFrame(
    {
        "Date": [
            "01012019",
            "01022019",
            "01032019",
            "01042019",
            "01052019",
            "01062019",
            "01072019",
            "01082019",
        ],
        "Price": [77, 76, 68, 70, 78, 79, 74, 75],
    }
)
df["Date"] = pd.to_datetime(df["Date"], format="%d%m%Y")

plt.figure(figsize=(15, 8))
ax = sns.barplot(x="Date", y="Price", data=df)
ax.set_xticklabels(["Jan", "Feb", "Mar", "Apr", "May", "Jun", "Jul", "Aug"])
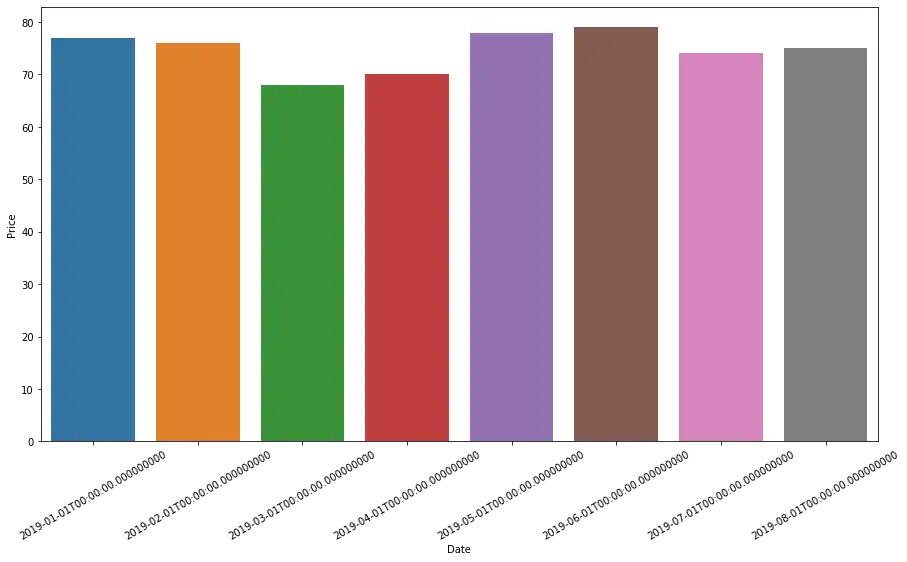
我们还可以对最终结果进行细微的定制。我们可以使用 rotation 参数将最终刻度标签旋转一定程度或使用 size 参数更改其字体大小。
如果我们想在默认刻度标签上使用这些参数,我们可以使用 get_xticklabels() 函数。它从图中返回默认刻度标签的列表。当我们想要使用 rotation 或 size 参数自定义默认刻度标签时,我们可以使用此函数。
检查以下代码以了解如何使用此功能。
import pandas as pd
import matplotlib.pyplot as plt
import seaborn as sns

df = pd.DataFrame(
    {
        "Date": [
            "01012019",
            "01022019",
            "01032019",
            "01042019",
            "01052019",
            "01062019",
            "01072019",
            "01082019",
        ],
        "Price": [77, 76, 68, 70, 78, 79, 74, 75],
    }
)
df["Date"] = pd.to_datetime(df["Date"], format="%d%m%Y")

plt.figure(figsize=(15, 8))
ax = sns.barplot(x="Date", y="Price", data=df)
ax.set_xticklabels(ax.get_xticklabels(), rotation=30, size=10)
同样,我们可以使用 set_yticklabels() 和 get_yticklabels() 函数在 y 轴上执行函数。
Enjoying our tutorials? Subscribe to DelftStack on YouTube to support us in creating more high-quality video guides. Subscribe
作者: Manav Narula

Manav is a IT Professional who has a lot of experience as a core developer in many live projects. He is an avid learner who enjoys learning new things and sharing his findings whenever possible.
LinkedIn