在 Seaborn 绘图中添加轴标签
Manav Narula
2023年1月30日
Seaborn
Seaborn Label
Seaborn Axis
-
使用
set_xlabel()和set_ylabel()函数在 Seaborn 图中设置轴标签 -
使用
set()函数在 Seaborn 绘图中设置轴标签 -
使用
matplotlib.pyplot.xlabel()和matplotlib.pyplot.ylabel()函数设置 Seaborn 绘图的轴标签

在本教程中,我们将讨论如何在 Python 的 seaborn 图中添加 x 和 y 轴标签。
默认情况下,当我们在绘图函数中指定 x 和 y 轴的值时,图形会将这些值用作两个轴的标签。我们将讨论其他方法来显式添加所需的轴标签。
使用 set_xlabel() 和 set_ylabel() 函数在 Seaborn 图中设置轴标签
Seaborn 图返回一个 matplotlib 轴实例类型对象。我们可以使用 set_xlabel() 和 set_ylabel 分别设置 x 和 y 轴标签。
例如,
import pandas as pd
import matplotlib.pyplot as plt
import seaborn as sns

df = pd.DataFrame(
    {"Day 1": [7, 1, 5, 6, 3, 10, 5, 8], "Day 2": [1, 2, 8, 4, 3, 9, 5, 2]}
)

p = sns.lineplot(data=df)
p.set_xlabel("X-Axis", fontsize=20)
p.set_ylabel("Y-Axis", fontsize=20)
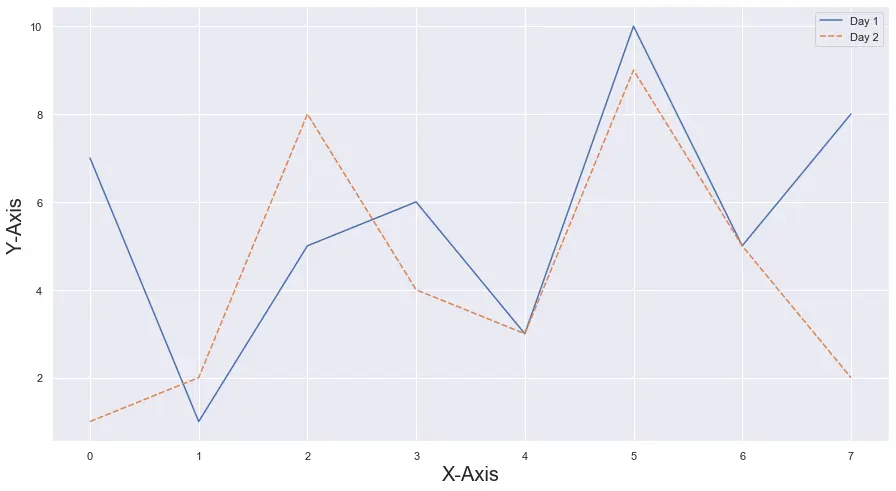
我们可以使用 fontsize 参数来控制字体的大小。
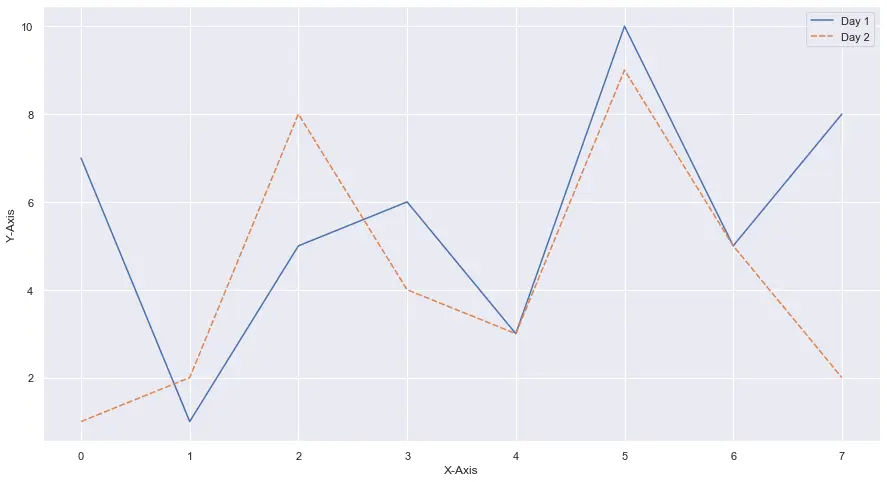
使用 set() 函数在 Seaborn 绘图中设置轴标签
set() 函数用于向图中添加不同的元素,并可用于添加轴标签。我们使用 xlabel 和 ylabel 参数来指定标签。
例如,
import pandas as pd
import matplotlib.pyplot as plt
import seaborn as sns

df = pd.DataFrame(
    {"Day 1": [7, 1, 5, 6, 3, 10, 5, 8], "Day 2": [1, 2, 8, 4, 3, 9, 5, 2]}
)

p = sns.lineplot(data=df)
p.set(xlabel="X-Axis", ylabel="Y-Axis")

使用 matplotlib.pyplot.xlabel() 和 matplotlib.pyplot.ylabel() 函数设置 Seaborn 绘图的轴标签
这些功能用于为当前绘图的两个轴设置标签。可以使用诸如 size、fontweight、fontsize 之类的不同参数来更改标签的大小和形状。
以下代码演示了它们的用法。
import pandas as pd
import matplotlib.pyplot as plt
import seaborn as sns

df = pd.DataFrame(
    {"Day 1": [7, 1, 5, 6, 3, 10, 5, 8], "Day 2": [1, 2, 8, 4, 3, 9, 5, 2]}
)

p = sns.lineplot(data=df)
plt.xlabel("X-Axis")
plt.ylabel("Y-Axis")
Enjoying our tutorials? Subscribe to DelftStack on YouTube to support us in creating more high-quality video guides. Subscribe
作者: Manav Narula

Manav is a IT Professional who has a lot of experience as a core developer in many live projects. He is an avid learner who enjoys learning new things and sharing his findings whenever possible.
LinkedIn