Seaborn 绘图中的字体大小
Manav Narula
2023年1月30日
Seaborn
Seaborn Font
在本教程中,我们将讨论如何更改 seaborn 图中的字体大小。
使用 seaborn.set() 函数在 Seaborn 绘图中设置字体大小
我们可以使用 seaborn.set() 函数来更改 Seaborn 绘图的配置和主题。要设置字体大小,我们在此函数中使用 font_scale 参数。此参数会自动更改图形中所有内容的字体,从图例到轴标签以及所有内容。
请参考下面的代码以了解其用法。
import pandas as pd
import matplotlib.pyplot as plt
import seaborn as sns

df = pd.DataFrame(
    {"Day 1": [7, 1, 5, 6, 3, 10, 5, 8], "Day 2": [1, 2, 8, 4, 3, 9, 5, 2]}
)

sns.set(font_scale=2)
p = sns.lineplot(data=df)
p.set_xlabel("X-Axis")
p.set_ylabel("Y-Axis")
p.set_title("Plot")
plt.legend(labels=["Legend_Day1", "Legend_Day2"])
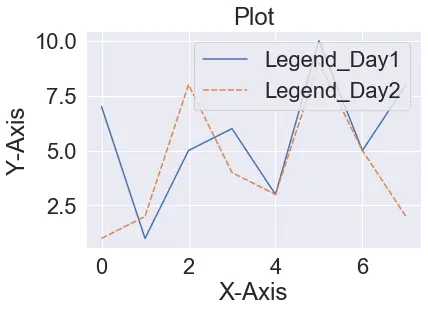
如果函数中未指定任何内容,则它将所有内容设置为默认值。注意使用不同的函数添加不同的元素,以及 set() 函数如何立即更改所有内容的大小。
使用 fontsize 参数更改 Seaborn 图中的字体大小
有时,我们使用不同的功能在图中包含不同的元素。我们可以通过将 fontsize 参数设置为其所需的值来改变诸如轴的标签、图例和标题等元素的大小。
以下代码将对此进行解释。
import seaborn as sns
import pandas as pd
import matplotlib.pyplot as plt

df = pd.DataFrame(
    {"Day 1": [7, 1, 5, 6, 3, 10, 5, 8], "Day 2": [1, 2, 8, 4, 3, 9, 5, 2]}
)

sns.set()
p = sns.lineplot(data=df)
p.set_xlabel("X-Axis", fontsize=20)
p.set_ylabel("Y-Axis", fontsize=20)
p.set_title("Plot", fontsize=20)
plt.legend(labels=["Legend_Day1", "Legend_Day2"], fontsize=20)
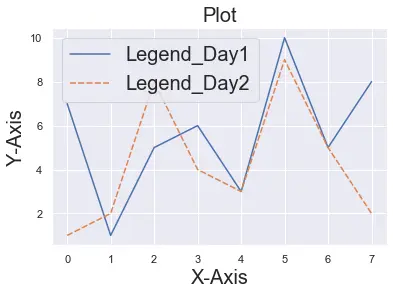
如先前方法中所讨论的,在绘图之前使用 sns.set() 函数将所有内容设置为默认值。
Enjoying our tutorials? Subscribe to DelftStack on YouTube to support us in creating more high-quality video guides. Subscribe
作者: Manav Narula

Manav is a IT Professional who has a lot of experience as a core developer in many live projects. He is an avid learner who enjoys learning new things and sharing his findings whenever possible.
LinkedIn