在 Seaborn 散点图中设置标记大小

散点图被认为是最基本和最常用的图形之一。它可以帮助识别变量之间的任何潜在模式并显示它们的关系。
在 Python 中,seaborn 模块被认为对于创建不同类型的图非常有效。它基于 matplotlib 库,使用起来相对简单。seaborn 模块中的 scatterplot() 函数可以用来创建散点图。
在本教程中,我们将讨论如何设置散点图中标记的大小。
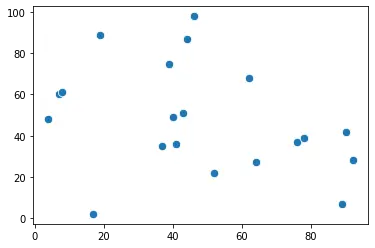
要设置标记的大小,我们可以使用 s 参数。由于 seaborn 是基于 matplotlib 模块构建的,因此可以使用此参数。我们可以在 scatterplot() 函数中指定此参数并将其设置为某个值。
例如,
import random
import seaborn as sns
import matplotlib as plt

s_x = random.sample(range(0, 100), 20)
s_y = random.sample(range(0, 100), 20)

sns.scatterplot(y=s_y, x=s_x, s=70)
或者,我们可以根据一些变量来控制点的大小。在此方法中,我们将所需的变量指定为该参数的值。
请参考下面的代码。
import random
import seaborn as sns
import matplotlib as plt

s_x = random.sample(range(0, 100), 20)
s_y = random.sample(range(0, 100), 20)

sns.scatterplot(y=s_y, x=s_x, s=s_x)
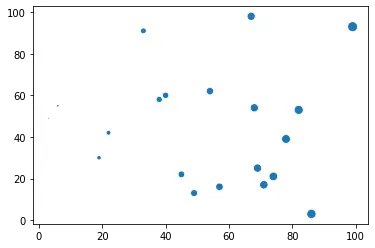
我们使用 s_x 变量来控制标记的大小,因此对于 s_x 值越高,点的大小就越大。或者,我们也可以使用 size 参数来实现相同的效果。它还根据一些变量更改标记的大小并添加图例以使事情更清晰。
例如,
import random
import seaborn as sns
import matplotlib as plt

s_x = random.sample(range(0, 100), 20)
s_y = random.sample(range(0, 100), 20)

sns.scatterplot(y=s_y, x=s_x, size=s_x, sizes=(50, 150))
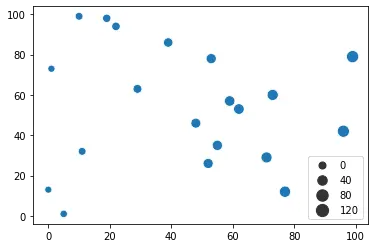
通常,还会使用 sizes 参数,它指定 size 参数的范围。如果我们使用 legend 参数并将其设置为 full,则将显示每个唯一标记的大小。
此外,我们可以使用 color 或 marker 参数来更改标记的颜色和形状。使用 seaborn 模块,散点图中的标记有许多不同的形状可用。

Manav is a IT Professional who has a lot of experience as a core developer in many live projects. He is an avid learner who enjoys learning new things and sharing his findings whenever possible.
LinkedIn