Python 中的双线性插值
Vaibhhav Khetarpal
2023年1月30日
Python
Python Interpolation

线性插值在线性多项式的帮助下用于曲线拟合。
双线性插值是线性插值的扩展,用于在线性插值的帮助下对任意两个给定变量的函数进行插值。
让我们演示在 Python 中实现双线性插值的不同方法。
在 Python 中创建一个用户定义函数以实现双线性插值
在这里,我们创建了一个与四个点关联的用户定义函数,并利用 Python 中的双线性插值。
def bilinterpol(a, b, pts):
    i = sorted(pts)
    (a1, b1, x11), (_a1, b2, x12), (a2, _b1, x21), (_a2, _b2, x22) = i
    if a1 != _a1 or a2 != _a2 or b1 != _b1 or b2 != _b2:
        print("The given points do not form a rectangle")
    if not a1 <= a <= a2 or not b1 <= b <= b2:
        print("The (a, b) coordinates are not within the rectangle")
    Y = (
        x11 * (a2 - a) * (b2 - b)
        + x21 * (a - a1) * (b2 - b)
        + x12 * (a2 - a) * (b - b1)
        + x22 * (a - a1) * (b - b1)
    ) / ((a2 - a1) * (b2 - b1) + 0.0)
    return Y


pts = [
    (0, 1, 12),
    (4, 1, 0),
    (0, 3, -4),
    (4, 3, 8),
]
print(bilinterpol(2, 3, pts))
输出:
2.0
在 Python 中使用 scipy.interpolate.interp2d() 实现双线性插值
SciPy 库是 Scientific Python 的缩写,是开源的。
由大量实用函数组成,有助于数据科学、优化、插值、线性代数、信号处理等。SciPy 库使用并依赖于 NumPy 库。
此方法可以处理处理 NumPy 数组的非常复杂的问题。我们案例中的 scipy.interpolate.interp2d() 函数在 2d 网格上实现双线性插值。
语法:
scipy.interpolate.interp2d(
    x, y, z, kind="linear", copy=True, bounds_error=False, fill_value=None
)
该函数包含三个重要参数,需要理解这些参数才能正确使用它。
x, y都包含类似数组的值,描述给定坐标的数据点。x表示列坐标。相反,考虑到数据点位于网格上,y表示行坐标。z包含类似数组的值,它指定要使用给定数据点集内插的函数的值。kind指定要使用的插值类型。它可以是linear、cubic或quintic。如果没有传递参数,则该值默认为linear。
以下代码使用 scipy.interpolate.interp2d() 在 Python 中实现双线性插值。
from scipy import interpolate
import numpy as np
import matplotlib.pyplot as plt

x = np.arange(-15.01, 15.01, 1.00)
y = np.arange(-15.01, 15.01, 1.00)
xx, yy = np.meshgrid(x, y)
z = np.cos(xx ** 2 + yy ** 2)
f = interpolate.interp2d(x, y, z, kind="quintic")
xnew = np.arange(-15.01, 15.01, 1e-2)
ynew = np.arange(-15.01, 15.01, 1e-2)
znew = f(xnew, ynew)
plt.plot(x, z[0, :], "ro-", xnew, znew[0, :], "b-")
plt.show()
输出:
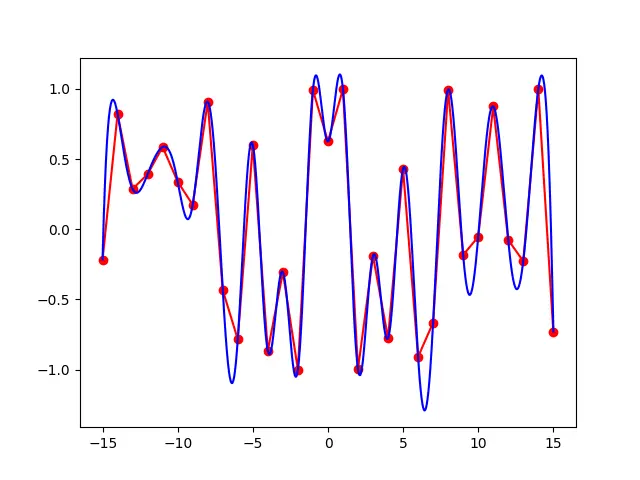
代码说明:
- 所有三个基本库,即
SciPy、NumPyc和MatPlotLib,都被导入到代码中。 - 然后使用
numpy.arrange()函数以数组的形式将值插入变量x 和 y。 - 继续执行
meshgrid()函数,该函数生成一个1d数组,其中x 和 y作为笛卡尔索引。 - 然后,利用
cos()函数求余弦值,该余弦值确定代码中的主函数z的值。 - 最后,在
matplotlib库函数的帮助下描述了结果。
Enjoying our tutorials? Subscribe to DelftStack on YouTube to support us in creating more high-quality video guides. Subscribe

Vaibhhav is an IT professional who has a strong-hold in Python programming and various projects under his belt. He has an eagerness to discover new things and is a quick learner.
LinkedIn