Matplotlib 颜色条范围
Manav Narula
2023年1月30日
Matplotlib
Matplotlib Colorbar

颜色条可用于表示绘图的数字与颜色的比率。它就像一把钥匙,显示哪些数字用哪些颜色表示。它是绘图轴对象的一个实例,可以轻松自定义。
在本文中,我们将学习如何在 matplotlib 图形中设置颜色条的范围。
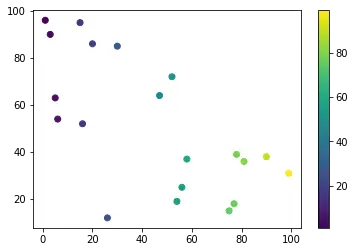
通过控制颜色条的范围,我们可以将颜色限制在特定的值范围内。我们将改变下图的颜色条范围。
import random
import matplotlib.pyplot as plt

s_x = random.sample(range(0, 100), 20)
s_y = random.sample(range(0, 100), 20)

s = plt.scatter(s_x, s_y, c=s_x, cmap="viridis")

c = plt.colorbar()
在 Matplotlib 中使用 matpltolib.pyplot.clim() 函数设置颜色条的范围
clim() 函数可用于通过设置用于缩放的绘图的颜色限制来控制颜色条的范围。
例如,
import random
import matplotlib.pyplot as plt

s_x = random.sample(range(0, 100), 20)
s_y = random.sample(range(0, 100), 20)

s = plt.scatter(s_x, s_y, c=s_x, cmap="viridis")

c = plt.colorbar()
plt.clim(0, 150)
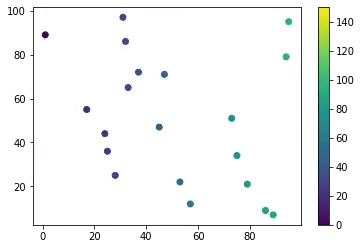
通过更改颜色条的范围,注意点的颜色与原始图的不同之处。
此前,set_clim() 函数也用于实现此目的。在多个子图中指定颜色条的范围非常有用。但是,此函数在 matplotlib 库的最新版本中已弃用,因此应避免使用。
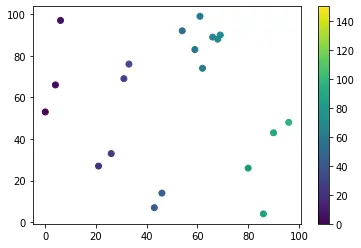
在 Python 中使用 vmin 和 vmax 参数设置颜色条的范围
vmin 和 vmax 参数可用于指定映射颜色值的比例。这些参数与使用颜色图的对象一起使用。
它可用于控制 matplotlib 中颜色条的范围。
例如,
import random
import matplotlib.pyplot as plt

s_x = random.sample(range(0, 100), 20)
s_y = random.sample(range(0, 100), 20)

s = plt.scatter(s_x, s_y, c=s_x, cmap="viridis", vmin=0, vmax=150)

c = plt.colorbar()
Enjoying our tutorials? Subscribe to DelftStack on YouTube to support us in creating more high-quality video guides. Subscribe
作者: Manav Narula

Manav is a IT Professional who has a lot of experience as a core developer in many live projects. He is an avid learner who enjoys learning new things and sharing his findings whenever possible.
LinkedIn