如何在 Matplotlib 中画一条任意线
Suraj Joshi
2023年1月30日
Matplotlib
Matplotlib Lines
-
Matplotlib 使用
matplotlib.pyplot.plot()方法绘制一条任意线 -
Matplotlib 使用
hlines()和vlines()方法绘制任意线 -
Matplotlib 使用
matplotlib.collections.LineCollection绘制任意线
本教程介绍了我们如何在 Matplotlib 中使用 matplotlib.pyplot.plot() 方法、matplotlib.pyplot.vlines() 方法或 matplotlib.pyplot.hlines() 方法和 matplotlib.collections.LineCollection 来绘制任意线条。
Matplotlib 使用 matplotlib.pyplot.plot() 方法绘制一条任意线
我们可以使用 matplotlib.pyplot.plot() 方法简单地绘制一条线。一般来说,绘制从 (x1,y1) 开始到 (x2,y2) 结束的任何一条线的语法是。
plot([x1, x2], [y1, y2])
import matplotlib.pyplot as plt

plt.plot([3, 5], [1, 6], color="green")
plt.plot([0, 5], [0, 5], color="red")
plt.xlabel("X")
plt.ylabel("Y")
plt.title("Plot with 2 arbitrary Lines")
plt.show()
输出:
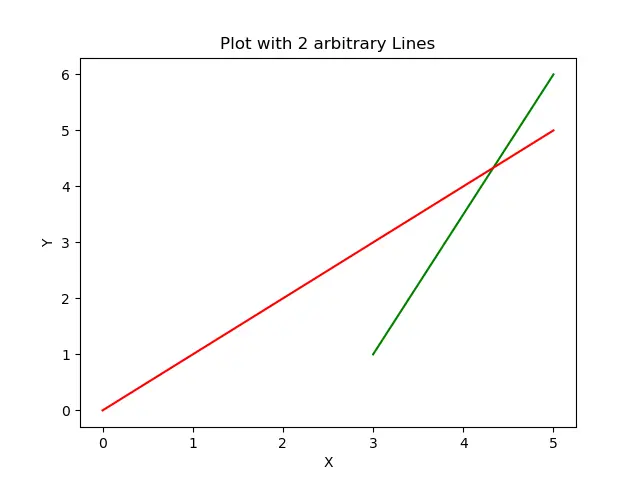
它在图中画两条任意线。第一条线用绿色表示,从 (3,1) 延伸到 (5,6),第二条线用红色表示,从 (0,0) 延伸到 (5,5)。
Matplotlib 使用 hlines() 和 vlines() 方法绘制任意线
使用 hlines() 和 vlines() 方法绘制任何线条的一般语法是。
vlines(x, ymin, ymax)
hlines(y, xmin, xmax)
import matplotlib.pyplot as plt

plt.hlines(3, 2, 5, color="red")
plt.vlines(6, 1, 5, color="green")
plt.xlabel("X")
plt.ylabel("Y")
plt.title("Plot arbitrary Lines")
plt.show()
输出:
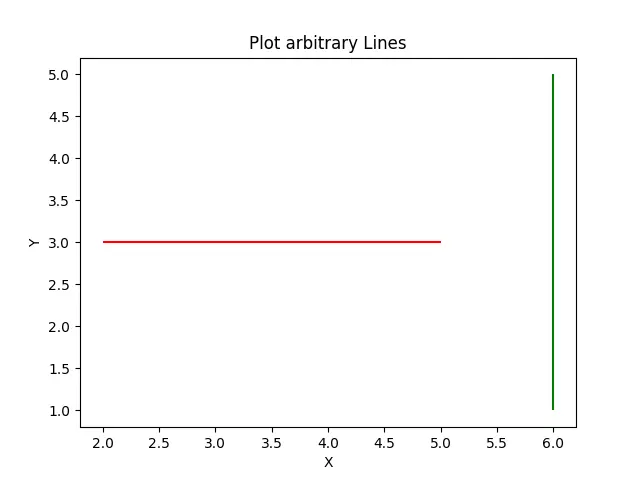
hlines() 方法用红色画一条水平线,其 Y 坐标在整条线上保持 3,X 坐标从 2 延伸到 5。vlines() 方法用绿色画一条垂直线,其 X 坐标在整条线上保持 6,Y 坐标从 1 延伸到 5。
Matplotlib 使用 matplotlib.collections.LineCollection 绘制任意线
import matplotlib.pyplot as plt
from matplotlib import collections

line_1 = [(1, 10), (6, 9)]
line_2 = [(1, 7), (3, 6)]

collection_1_2 = collections.LineCollection([line_1, line_2], color=["red", "green"])

fig, axes = plt.subplots(1, 1)
axes.add_collection(collection_1_2)
axes.autoscale()
plt.show()
输出:
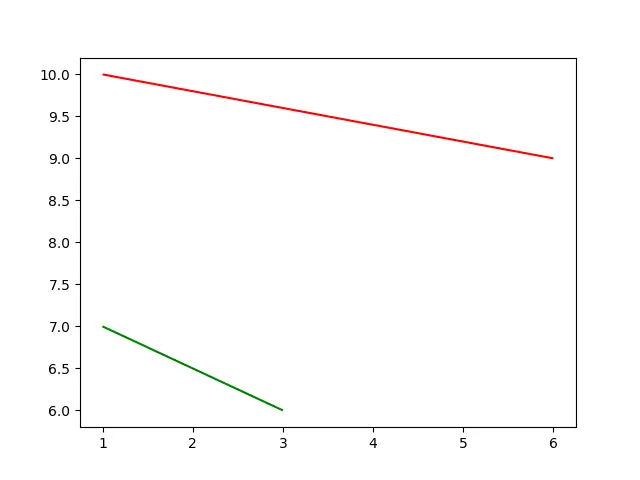
它从 line_1 和 line_2 中创建线条集合,然后将集合添加到图中。
Enjoying our tutorials? Subscribe to DelftStack on YouTube to support us in creating more high-quality video guides. Subscribe
作者: Suraj Joshi

Suraj Joshi is a backend software engineer at Matrice.ai.
LinkedIn