使用 MATLAB 进行二维插值
Ammar Ali
2024年2月15日
MATLAB
MATLAB Vector
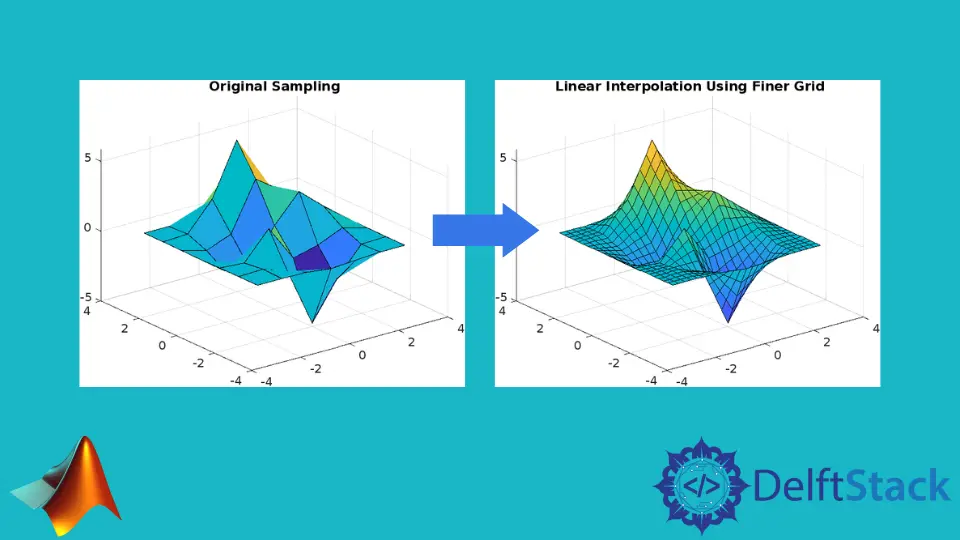
本教程将讨论使用 MATLAB 中的 interp2() 函数查找二维数据的插值。
使用 MATLAB 中的 interp2() 函数查找二维数据的插值
我们可以使用 MATLAB 的内置函数 interp2() 函数来查找网格格式的二维网格数据的插值。例如,让我们使用默认方法在网格上进行插值。
请参阅下面的代码。
clc
[x,y] = meshgrid(-3:3);
v = peaks(x,y);
figure
surf(x,y,v)
title('Original Sampling');
[xq,yq] = meshgrid(-3:0.25:3);
vq = interp2(x,y,v,xq,yq);
figure
surf(xq,yq,vq);
title('Linear Interpolation Using Finer Grid');
输出:
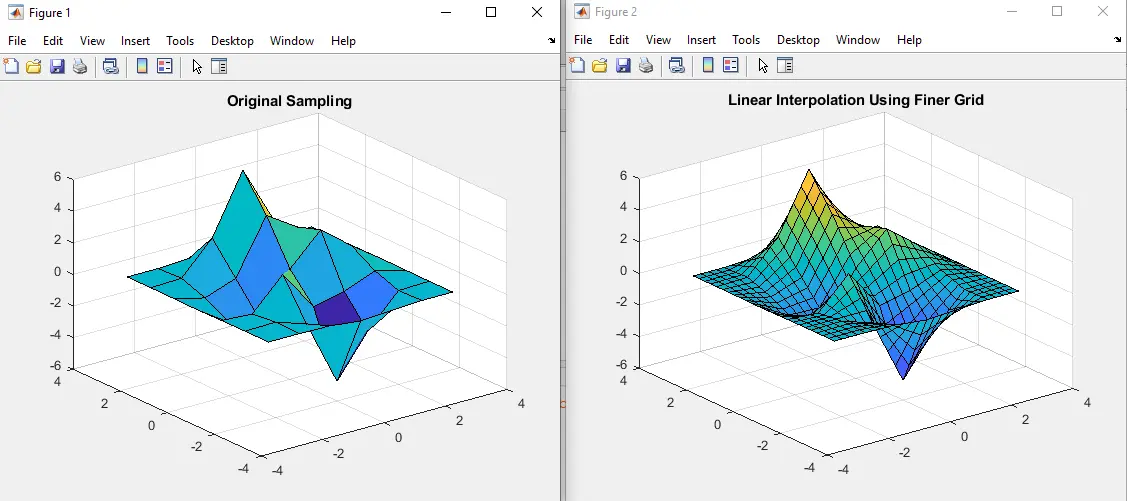
在输出中,右侧的图像是使用默认方法进行插值的结果。
如你所见,与原始图像相比,输出图像具有更多数据点。x 和 y 向量是输入矩阵,它们应该具有相同的大小。
v 向量包含样本值。如果 v 包含复数,则它可以包含实数或复数。
然后,interp2() 函数将分别插入实部和虚部。向量 xq 和 yq 包含查询点,可以是实数标量、向量、矩阵或数组。
我们还可以通过在 interp2() 函数中将新方法定义为字符串来更改插值方法,就像我们可以为插值设置三次、最近或样条方法一样。我们可以使用插值来细化灰度图像。
如果图像的像素较少,则图像内部的细节将不可见。在这种情况下,我们可以使用插值来增加像素数来理解图像。
例如,让我们将灰度图像加载到 MATLAB 中并使用 interp2() 函数对其进行优化。请参阅下面的代码。
clc
clear
load flujet.mat
colormap gray
v = single(X(200:300,1:25));
figure
imagesc(v);
axis off
title('Original Image')
vq = interp2(v,5);
figure
imagesc(vq);
axis off
title('Linear Interpolation')
输出:
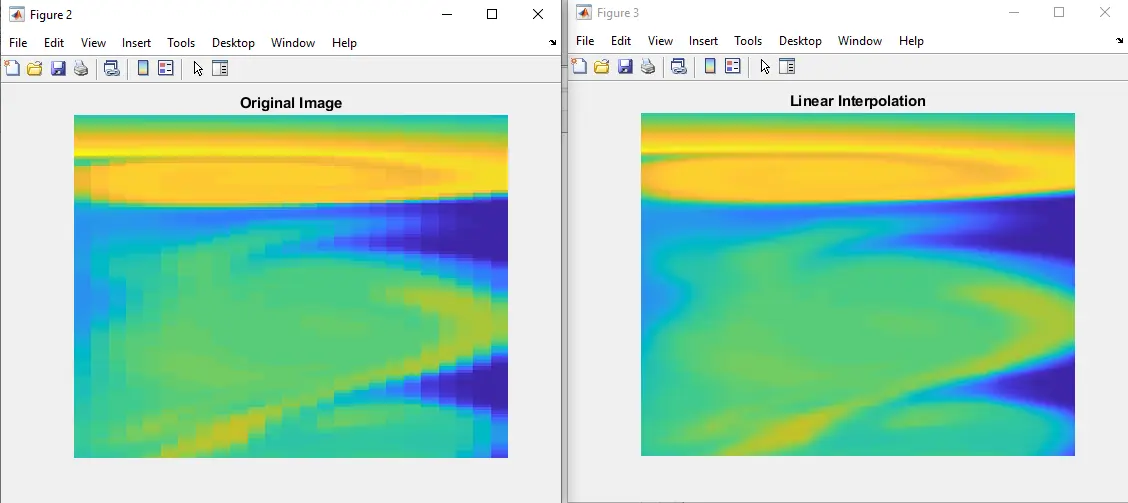
在输出中,使用线性插值对右侧图像进行细化。函数 single() 用于将值转换为单精度。
Enjoying our tutorials? Subscribe to DelftStack on YouTube to support us in creating more high-quality video guides. Subscribe
作者: Ammar Ali
