使用 seaborn.lmplot() 函式繪製圖形

seaborn 模組用於在 Python 中建立統計圖。它建立在 matplotlib 模組之上,因此使用起來非常簡單。
seaborn.lmplot() 函式使用給定的資料在 FacetGrid 上建立一個基本的散點圖。
請參考以下程式碼。
import pandas as pd
import matplotlib.pyplot as plt
import seaborn as sns
import random

x = range(50)
y = random.sample(range(100), 50)
cat = [i for i in range(2)] * 25
df = pd.DataFrame({"x": x, "y": y, "Category": cat})

sns.lmplot(x="x", y="y", data=df, fit_reg=False, hue="Category")
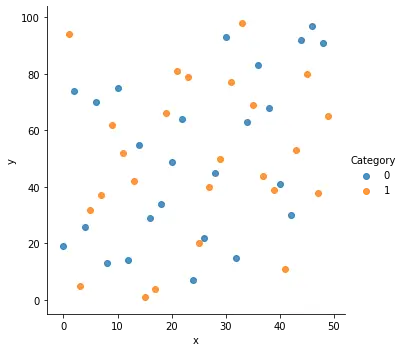
但是,此函式的使用超出了繪製散點圖的範圍。它還可用於通過在圖中繪製可選的迴歸線來了解資料之間的關係。它也可以用於邏輯迴歸。
與也用於執行簡單迴歸和繪製資料的 seaborn.regplot() 函式不同,seaborn.lmplot() 函式將 seaborn.FacetGrid() 與 seaborn.regplot() 結合在一起。
FacetGrid() 用於視覺化資料分佈與其他資料子集之間的關係,並可用於為多個圖建立網格。它適用於提供行、列和色調的三個軸。當我們處理複雜的資料集時,它非常有用。
我們還可以使用 seaborn.lmplot() 函式使用不同的引數自定義最終圖形。我們可以為 line_kws 和 scatter_kws 引數提供必要的自定義,例如繪圖的顏色,作為字典的鍵值對。
在下面的程式碼中,我們將使用此函式繪製帶有迴歸線的圖形。
import pandas as pd
import matplotlib.pyplot as plt
import seaborn as sns
import random

x = range(50)
y = random.sample(range(100), 50)
cat = [i for i in range(2)] * 25
df = pd.DataFrame({"x": x, "y": y, "Category": cat})

sns.lmplot(x="x", y="y", data=df, hue="Category")
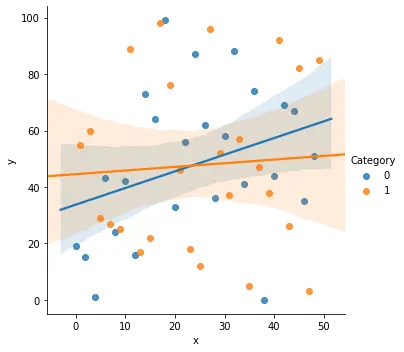
請注意,fit_reg 引數預設設定為 True。我們的資料集有多個類別,因此我們能夠繪製多條迴歸線。如果我們刪除了 hue 引數,那麼就會得到一個單一的迴歸圖。我們還可以進一步使用許多引數進行迴歸。其中一些包括用於向資料新增一些噪聲的 jitter 引數,或用於繪製給定估計值的 estimator 引數。

Manav is a IT Professional who has a lot of experience as a core developer in many live projects. He is an avid learner who enjoys learning new things and sharing his findings whenever possible.
LinkedIn