Seaborn 中的貓圖
seaborn 模組中有許多型別的圖可用。但是,在處理分類值時,我們可能需要一種常量方法來繪製資料,因為不同的繪圖函式的工作方式不同。這種方法與資料不一致。該模組的 catplot() 函式用於有效地處理分類資料。此函式旨在改進最新版本的 seaborn 模組中的 factorplot() 函式。
它使我們能夠有效地處理分類值,並且我們可以將資料繪製成由 kind 引數指定的八種不同型別的圖形。catplot() 函式返回一個 FacetGrid() 型別的物件,因此可以有效地利用它為同一圖形上的多個特徵繪製圖形。
使用 catplot() 函式很簡單。請參考以下程式碼。
import pandas as pd
import matplotlib.pyplot as plt
import seaborn as sns
df = pd.DataFrame(
{
"Product": [1, 1, 2, 3, 1, 2, 2, 3, 3, 3, 3, 1, 2, 2, 1],
"Max_Price": [78, 79, 55, 26, 80, 54, 50, 24, 25, 22, 23, 80, 53, 54, 77],
}
)
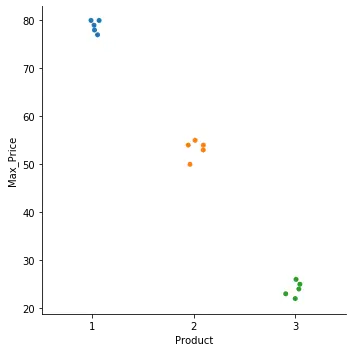
sns.catplot(data=df, x="Product", y="Max_Price", kind="strip")
請注意,我們在 x 軸上繪製了產品類別,在 y 軸上繪製了所需的特徵 Max_Price。這種方法對於研究具有類別的不同特徵非常方便。
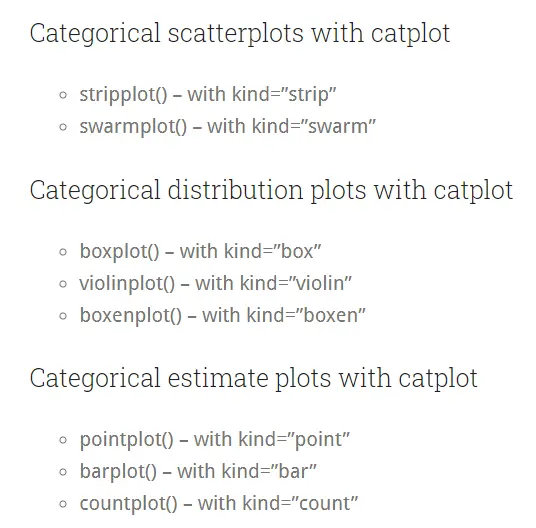
在上面的程式碼中,我們通過將 kind 引數指定為 strip 繪製了一個 stripplot()。我們可以將其更改為任何需要的圖,例如 barplot() 的 bar,boxplot() 的 box,等等。檢查下圖以瞭解有關使用此功能可能的所有不同繪圖的更多資訊。
其他引數可用於自定義最終圖形。例如,我們可以分別使用 height 和 aspect 引數更改最終圖形的大小,使用 order 引數更改繪製的類別的順序,等等。

Manav is a IT Professional who has a lot of experience as a core developer in many live projects. He is an avid learner who enjoys learning new things and sharing his findings whenever possible.
LinkedIn