在 Python 中繪製 ROC 曲線
在本指南中,我們將幫助你更多地瞭解這個 Python 函式以及你可以用來繪製 ROC 曲線作為程式輸出的方法。
Python 中的 ROC 曲線定義
術語 ROC 曲線代表接收者操作特徵曲線。該曲線基本上是任何分類模型在所有分類閾值下的效能的圖形表示。
這條曲線有兩個引數:
- 真陽性率(TPR) - 代表真實,即真實靈敏度
- False Positive Rate(FPR) - 代表偽,即假靈敏度
這兩個引數都稱為操作特性,並用作定義 ROC 曲線的因素。
在 Python 中,模型的效率是通過檢視曲線下面積 (AUC) 來確定的。因此,效率最高的模型的 AUC 等於 1,效率最低的模型的 AUC 等於 0.5。
Python 中的 Scikit-Learn 庫
Scikit-learn 庫是用於在 Python 中執行機器學習的最重要的開源庫之一。該庫包含許多用於分類、聚類和迴歸等任務的工具。
在本教程中,使用了這個庫中的幾個函式來幫助繪製 ROC 曲線。這些功能是:
make_classification- 匯入此函式是因為它通過建立點簇來幫助生成隨機的 n 類分類問題。RandomForestClassifier- 此函式作為Random Forest Classifier匯入,並用作本教程中製作 ROC 曲線的示例模型。train_test_split- 此函式用於將整個資料拆分為兩個子集(Train和Test),用於訓練和測試資料。roc_curve- 此函式用於返回給定模型的 ROC 曲線。
繪製 ROC 曲線的 Python 程式碼
import numpy as np
import pandas as pd
import matplotlib.pyplot as plt
import seaborn as sns
from sklearn.datasets import make_classification
from sklearn.ensemble import RandomForestClassifier
from sklearn.model_selection import train_test_split
from sklearn.metrics import roc_curve


def plot_roc_curve(fper, tper):
    plt.plot(fper, tper, color="red", label="ROC")
    plt.plot([0, 1], [0, 1], color="green", linestyle="--")
    plt.xlabel("False Positive Rate")
    plt.ylabel("True Positive Rate")
    plt.title("Receiver Operating Characteristic Curve")
    plt.legend()
    plt.show()


data_X, cls_lab = make_classification(
    n_samples=2100, n_classes=2, weights=[1, 1], random_state=2
)
train_X, test_X, train_y, test_y = train_test_split(
    data_X, cls_lab, test_size=0.5, random_state=2
)

model = RandomForestClassifier()
model.fit(train_X, train_y)

prob = model.predict_proba(test_X)
prob = probs[:, 1]
fper, tper, thresholds = roc_curve(test_y, prob)
plot_roc_curve(fper, tper)
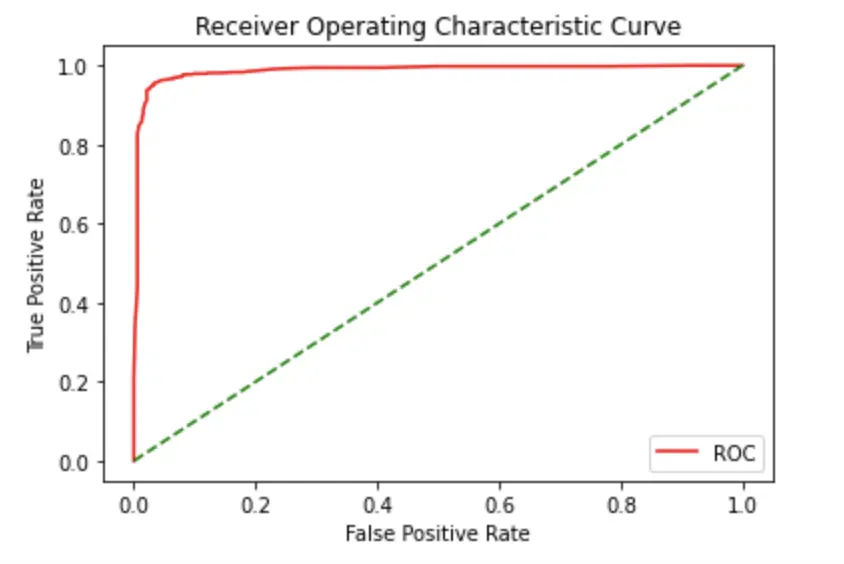
輸出:
程式碼說明
首先,匯入繪製 ROC 曲線所需的所有庫和函式。然後定義了一個名為 plot_roc_curve 的函式,其中使用 Matplotlib 庫提到了曲線的所有關鍵因素,如顏色、標籤和標題。之後,使用 make_classification 函式製作隨機樣本,然後在 train_test_split 函式的幫助下將它們分為 train 和 test 集。在這裡,資料的 train-test 比率是 0.50。然後使用 RandomForestClassifier 演算法來擬合 train_X 和 train_y 資料。最後,roc_curve 函式用於繪製 ROC 曲線。

Lakshay Kapoor is a final year B.Tech Computer Science student at Amity University Noida. He is familiar with programming languages and their real-world applications (Python/R/C++). Deeply interested in the area of Data Sciences and Machine Learning.
LinkedIn