Python에서 ROC 곡선 그리기
이 가이드에서는이 Python 함수와 프로그램 출력으로 ROC 곡선을 그리는 데 사용할 수있는 방법에 대해 더 많이 알 수 있도록 도와줍니다.
Python의 ROC 곡선 정의
ROC 곡선이라는 용어는 수신기 작동 특성 곡선을 나타냅니다. 이 곡선은 기본적으로 모든 분류 임계 값에서 모든 분류 모델의 성능을 그래픽으로 표현한 것입니다.
이 곡선에는 두 가지 매개 변수가 있습니다.
- True Positive Rate (TPR)-실제, 즉 실제 감도를 나타냅니다.
- False Positive Rate (FPR)-의사, 즉 거짓 감도를 나타냅니다.
두 매개 변수 모두 작동 특성으로 알려져 있으며 ROC 곡선을 정의하는 요소로 사용됩니다.
Python에서 모델의 효율성은 곡선 아래 영역 (AUC)을보고 결정됩니다. 따라서 가장 효율적인 모델의 AUC는 1이고 가장 효율적인 모델의 AUC는 0.5입니다.
Python의 Scikit-Learn 라이브러리
Scikit-learn라이브러리는 Python에서 기계 학습을 수행하는 데 사용되는 가장 중요한 오픈 소스 라이브러리 중 하나입니다. 이 라이브러리는 분류, 클러스터링 및 회귀와 같은 작업을위한 많은 도구로 구성됩니다.
이 튜토리얼에서는 ROC 곡선을 그리는 데 도움이되는이 라이브러리의 여러 함수가 사용됩니다. 이러한 기능은 다음과 같습니다.
make_classification- 이 함수는 포인트 군집을 생성하여 임의의 n-class 분류 문제를 생성하는 데 도움이되기 때문에 가져옵니다.RandomForestClassifier- 이 함수는Random Forest Classifier로 가져 와서 ROC 곡선이 만들어지는이 튜토리얼에서 샘플 모델로 사용됩니다.train_test_split- 이 함수는 전체 데이터를 데이터 학습 및 테스트에 사용되는 두 개의 하위 집합 (Train및Test)으로 분할하는 데 사용됩니다.roc_curve- 이 함수는 주어진 모델의 ROC 곡선을 반환하는 데 사용됩니다.
ROC 곡선을 그리는 Python 코드
import numpy as np
import pandas as pd
import matplotlib.pyplot as plt
import seaborn as sns
from sklearn.datasets import make_classification
from sklearn.ensemble import RandomForestClassifier
from sklearn.model_selection import train_test_split
from sklearn.metrics import roc_curve


def plot_roc_curve(fper, tper):
    plt.plot(fper, tper, color="red", label="ROC")
    plt.plot([0, 1], [0, 1], color="green", linestyle="--")
    plt.xlabel("False Positive Rate")
    plt.ylabel("True Positive Rate")
    plt.title("Receiver Operating Characteristic Curve")
    plt.legend()
    plt.show()


data_X, cls_lab = make_classification(
    n_samples=2100, n_classes=2, weights=[1, 1], random_state=2
)
train_X, test_X, train_y, test_y = train_test_split(
    data_X, cls_lab, test_size=0.5, random_state=2
)

model = RandomForestClassifier()
model.fit(train_X, train_y)

prob = model.predict_proba(test_X)
prob = probs[:, 1]
fper, tper, thresholds = roc_curve(test_y, prob)
plot_roc_curve(fper, tper)
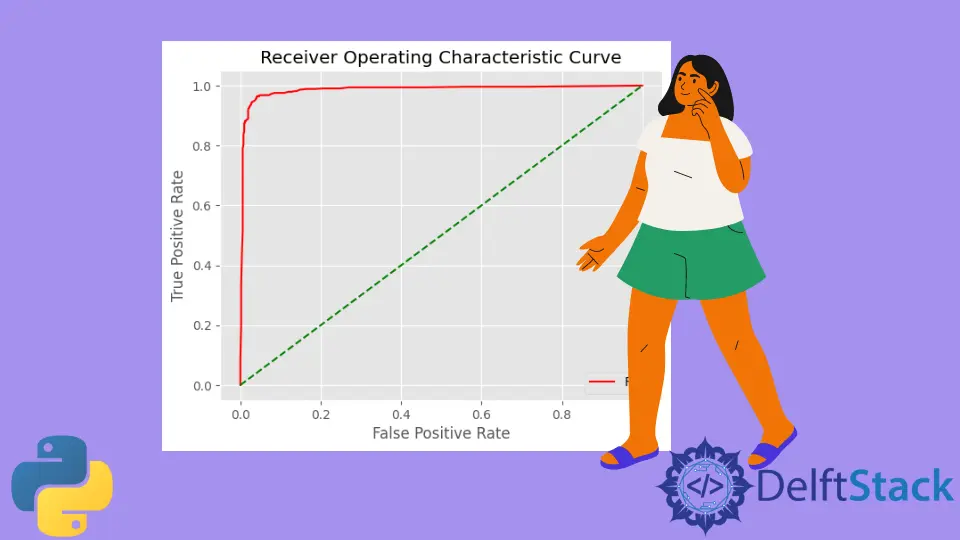
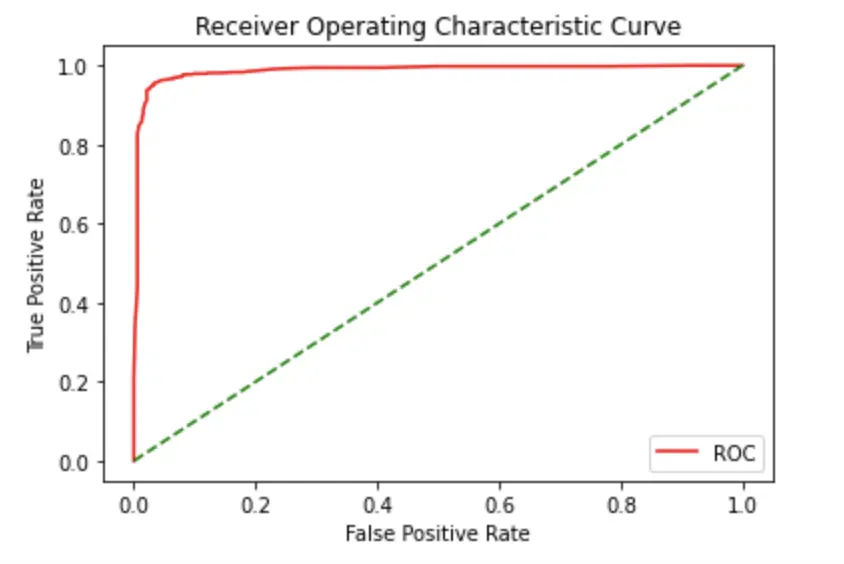
출력:
코드 설명
먼저 ROC 곡선을 그리는 데 필요한 모든 라이브러리와 함수를 가져옵니다. 그런 다음plot_roc_curve라는 함수가 정의되어Matplotlib라이브러리를 사용하여 색상, 레이블 및 제목과 같은 곡선의 모든 중요 요소가 언급됩니다. 그런 다음make_classification함수를 사용하여 무작위 샘플을 만든 다음train_test_split함수를 사용하여train및test세트로 나눕니다. 여기서 데이터의train-test비율은0.50입니다. 그런 다음RandomForestClassifier알고리즘을 사용하여train_X및train_y데이터를 맞 춥니 다. 마지막으로roc_curve함수는 ROC 곡선을 그리는 데 사용됩니다.

Lakshay Kapoor is a final year B.Tech Computer Science student at Amity University Noida. He is familiar with programming languages and their real-world applications (Python/R/C++). Deeply interested in the area of Data Sciences and Machine Learning.
LinkedIn