使用 Pandas DataFrame 建立餅圖
Luqman Khan
2023年1月30日
Pandas
Pandas DataFrame
- 使用 Pandas DataFrame 建立一個簡單的餅圖
- 使用 Pandas DataFrame 建立百分比餅圖
- 使用 Pandas DataFrame 建立帶顏色的餅圖
- 使用 Pandas DataFrame 建立具有爆炸效果的餅圖
- 使用 Pandas DataFrame 建立具有陰影效果的餅圖
- 使用 Pandas DataFrame 建立具有起始角度的餅圖
- まとめ

餅圖表示圓形圖中的資料,通常用於研究、工業和商業。
餅圖段代表資料的相對強度並用作其圖形表示。餅圖需要一個類別列表和數值變數。
餡餅的總價值總是 100%。
本文將介紹 Python Pandas 庫如何使用 DataFrame 建立餅圖。
使用 Pandas DataFrame 建立一個簡單的餅圖
在建立 DataFrame 並將其儲存在變數 data_frame 之前,我們必須首先匯入 Pandas 庫。此 DataFrame 包含兩列:一列用於每個學生的姓名,另一列用於每個學生的投票數。
import pandas as pd
現在,data_frame 變數儲存兩列的資料。
data_frame = pd.DataFrame(
    {
        "Name": [
            "John",
            "John",
            "John",
            "Jhon",
            "John",
            "Arapa",
            "Arapa",
            "Arapa",
            "Arapa",
            "Arapa",
            "Harry",
            "Harry",
            "Harry",
            "Harry",
            "Harry",
        ],
        "each_class_vote": [22, 12, 10, 18, 20, 17, 16, 13, 12, 14, 22, 19, 11, 19, 18],
    }
)
data_frame
輸出:
     Name    No_of_vote
0    John    22
1    John    12
2    John    10
3    Jhon    18
4    John    20
5    Arapa   17
6    Arapa   16
7    Arapa   13
8    Arapa   12
9    Arapa   14
10   Harry   22
11   Harry   19
12   Harry   11
13   Harry   19
14   Harry   18
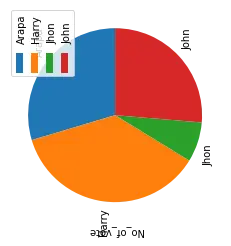
我們將使用帶有屬性 kind 的 plot() 函式繪製上述 data_frame 的餅圖。
data_frame.groupby(["Name"]).sum().plot(kind="pie", y="No_of_vote")
輸出:
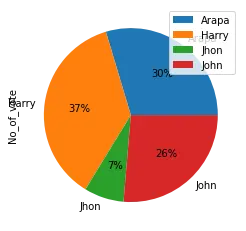
使用 Pandas DataFrame 建立百分比餅圖
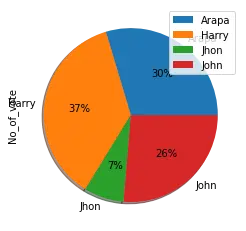
要新增另一個屬性,請使用 autopct 及其值。此屬性將百分比新增到餅圖。
data_frame.groupby(["Name"]).sum().plot(kind="pie", y="No_of_vote", autopct="%1.0f%%")
使用 Pandas DataFrame 建立帶顏色的餅圖
要在餅圖中新增屬性顏色,我們設定顏色列表。
語法:
plot(kind='pie', colors)
建立一個變數 colors 並使用顏色名稱分配顏色列表。
colors = ["pink", "silver", "steelblue", "blue"]
data_frame.groupby(["Name"]).sum().plot(
    kind="pie", y="No_of_vote", autopct="%1.0f%%", colors=colors
)
輸出:
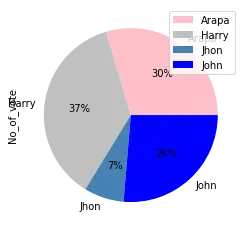
上面的輸出顯示顏色列表根據學生的姓名設定了 4 種顏色。
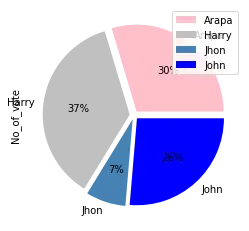
使用 Pandas DataFrame 建立具有爆炸效果的餅圖
分解餅圖的過程是將其拆分為多個部分。為此,我們使用 explode 屬性並將其分配給適當的值。
plot(kind='pie', explode)
建立一個名為 explode 的變數並將比率分配給它。
explode = (0.05, 0.05, 0.05, 0.05)
data_frame.groupby(["Name"]).sum().plot(
    kind="pie", y="No_of_vote", autopct="%1.0f%%", colors=colors, explode=explode
)
輸出:
使用 Pandas DataFrame 建立具有陰影效果的餅圖
使用值為 True 的陰影屬性在餅圖中新增陰影效果。這為餅圖增加了一個額外的維度。
plot(kind='pie', shadow=True)
data_frame.groupby(["Name"]).sum().plot(
    kind="pie", y="No_of_vote", autopct="%1.0f%%", shadow=True
)
輸出:
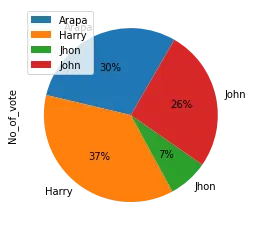
使用 Pandas DataFrame 建立具有起始角度的餅圖
如果我們想將餅圖旋轉到不同的角度,請使用此屬性及其適當的值。
語法:
plot(kind='pie', startangle)
將圖表旋轉 90 度
data_frame.groupby(["Name"]).sum().plot(
    kind="pie", y="votes_of_each_class", autopct="%1.0f%%", startangle=60
)
まとめ
在上面的文章中,首先,我們建立具有 2 列的 DataFrame,然後使用 Pandas 模組的 plot() 函式繪製餅圖。之後,我們對餅圖應用了不同的屬性和效果。
Enjoying our tutorials? Subscribe to DelftStack on YouTube to support us in creating more high-quality video guides. Subscribe