HOWTO · Matplotlib
Matplotlib Python 中的線型
本教程主要介紹了我們如何通過在 matplotlib.pyplot.plot()方法中設定適當的 `linestyle` 引數值,在 Matplotlib 繪圖中使用不同的線型。
本頁內容
本教程主要介紹了我們如何在 Matplotlib plot 中通過設定 matplotlib.pyplot.plot() 方法中 linestyle 引數的適當值來使用不同的線型。我們有很多 linestyle 的選項。
在 Matplotlib Python 中設定線條樣式
import math
import numpy as np
import matplotlib.pyplot as plt

x = np.linspace(0, 2 * math.pi, 100)
y = np.sin(x)

plt.plot(x, y)
plt.xlabel("x")
plt.ylabel("sinx")
plt.title("Sinx Function")
plt.show()
輸出:
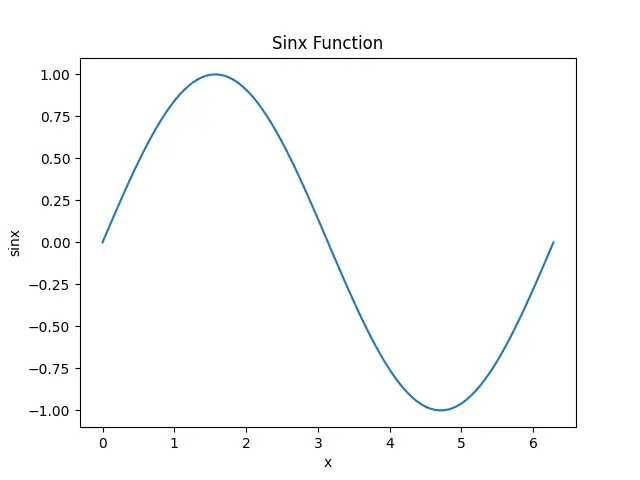
它以預設的實線樣式生成 sinx 函式的圖形。
要檢視 linestyle 引數的選擇,我們可以執行以下指令碼。
from matplotlib import lines

print(lines.lineStyles.keys())
輸出:
dict_keys(['-', '--', '-.', ':', 'None', ' ', ''])
我們可以使用任何一個輸出值來改變圖形的線型。
import math
import numpy as np
import matplotlib.pyplot as plt

x = np.linspace(0, 2 * math.pi, 100)
y = np.sin(x)

plt.plot(x, y, linestyle="-.")
plt.xlabel("x")
plt.ylabel("sinx")
plt.title("Sinx Function")
plt.show()
輸出:
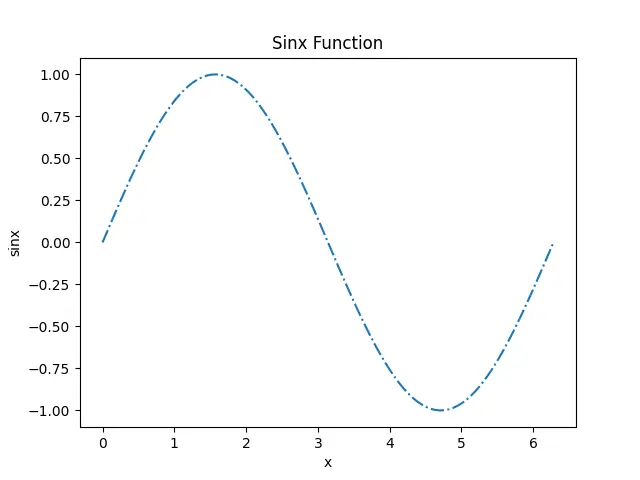
它將我們繪圖中的線條樣式設定為 -.。
Matplotlib Linestyle 文件提供了一個字典,我們可以用它來對線型進行更精細的控制。根據文件,我們可以用 (offset, (on_off_seq)) 元組來設定行樣式。
import math
import numpy as np
import matplotlib.pyplot as plt

from collections import OrderedDict

linestyles_dict = OrderedDict(
    [
        ("solid", (0, ())),
        ("loosely dotted", (0, (1, 10))),
        ("dotted", (0, (1, 5))),
        ("densely dotted", (0, (1, 1))),
        ("loosely dashed", (0, (5, 10))),
        ("dashed", (0, (5, 5))),
        ("densely dashed", (0, (5, 1))),
        ("loosely dashdotted", (0, (3, 10, 1, 10))),
        ("dashdotted", (0, (3, 5, 1, 5))),
        ("densely dashdotted", (0, (3, 1, 1, 1))),
        ("loosely dashdotdotted", (0, (3, 10, 1, 10, 1, 10))),
        ("dashdotdotted", (0, (3, 5, 1, 5, 1, 5))),
        ("densely dashdotdotted", (0, (3, 1, 1, 1, 1, 1))),
    ]
)

x = np.linspace(0, 2 * math.pi, 100)
y = np.sin(x)

plt.plot(x, y, linestyle=linestyles_dict["loosely dashdotdotted"])
plt.xlabel("x")
plt.ylabel("sinx")
plt.title("Sinx Function")
plt.show()
輸出:
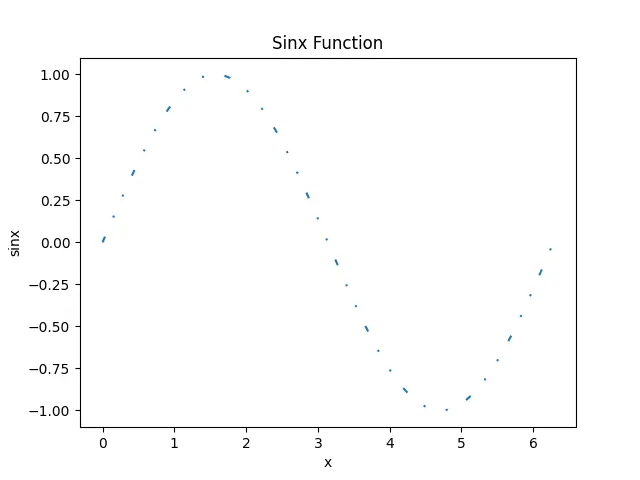
它使用 linestyles_dict 字典設定 linestyle。我們可以選擇任何我們想要設定線型的鍵,並將該鍵的值傳遞給 linestyles_dict 字典,作為 plot() 方法中的 linestyle 引數。