Matplotlib 中使用 Latex 公式
Suraj Joshi
2021年7月18日
Matplotlib
Matplotlib LaTex
本教程解釋了我們如何在 Matplotlib 中顯示 LaTex 公式或方程。
在 Matplotlib Python 中編寫 LaTex 公式
import math
import numpy as np
import matplotlib.pyplot as plt

x = np.linspace(0, 2 * math.pi, 100)
y = np.sin(x)

plt.plot(x, y)
plt.xlabel("x")
plt.ylabel(r"$\sin (x)$")
plt.title("Plot of sinx")
plt.show()
輸出:
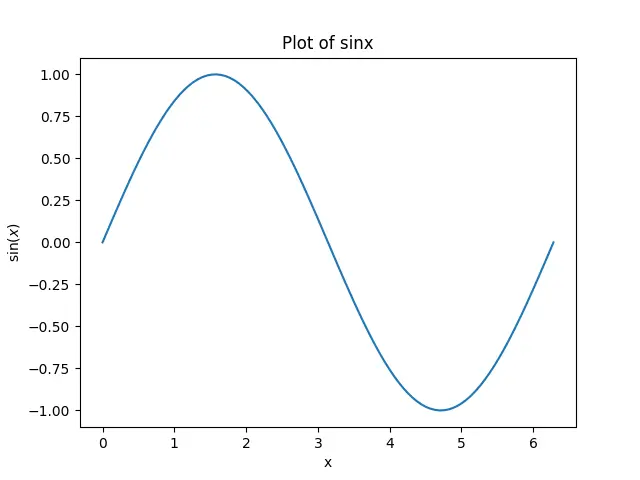
它將在 Matplotlib 圖中顯示 LaTex 公式。
要在 Matplotlib 中渲染 LaTex 公式,我們必須將'text.usetex'設定為 True。我們可以使用下面的指令碼來檢查'text.usetex'的值。
import matplotlib

print(matplotlib.rcParams["text.usetex"])
輸出:
False
如果你的系統將'text.usetex'改為 True,你可能會得到 True 的輸出。如果'text.usetex'被設定為 False,我們可以使用下面的指令碼將'text.usetex'設定為 True。
import matplotlib

matplotlib.rcParams["text.usetex"] = True
我們還需要有 LaTex、dvipng 和 Ghostscript (9.0 或更新版本)來渲染 LaTex 公式,並將所有的安裝依賴關係新增到 PATH 中。
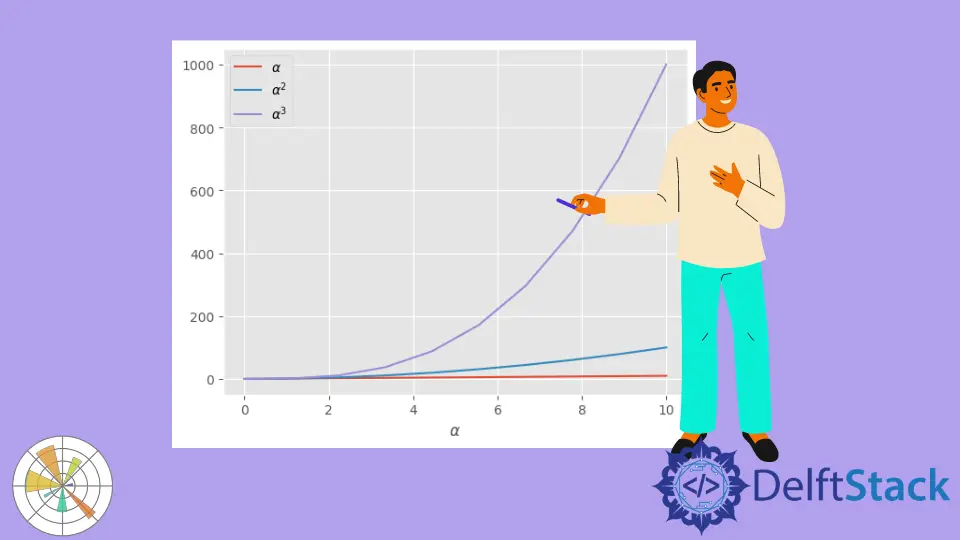
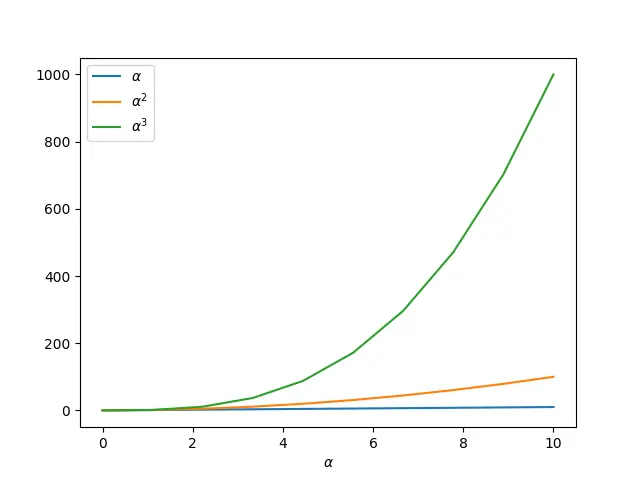
我們也可以在 Matplotlib 中使用 Tex 格式渲染希臘字母和更多的符號。
import numpy as np
import matplotlib.pyplot as plt

alpha = x = np.linspace(0, 10, 10)
y1 = alpha
y2 = alpha ** 2
y3 = alpha ** 3

plt.plot(x, y1, label=r"$\alpha$")
plt.plot(x, y2, label=r"$\alpha^2$")
plt.plot(x, y3, label=r"$\alpha^3$")
plt.xlabel(r"$\alpha$")
plt.legend()
plt.show()
輸出:
Enjoying our tutorials? Subscribe to DelftStack on YouTube to support us in creating more high-quality video guides. Subscribe
作者: Suraj Joshi

Suraj Joshi is a backend software engineer at Matrice.ai.
LinkedIn