Matplotlib 維恩圖
本教程將討論如何使用 Python 和 Matplotlib 庫生成維恩圖。
在 Python 中使用 Matplotlib 建立維恩圖
Matplotlib 庫使你能夠使用某些特定函式生成兩個圓和三圓維恩圖。使用特定命令,我們可以為維恩圖生成加權、未加權和可調的圓。
可調圓圈允許你進一步註釋或新增其他資訊到你的維恩圖。
我們要解決的第一個問題是兩圈維恩圖,所以讓我們開始吧。如果你的電腦上沒有安裝 matplotlib-venn,請使用以下命令安裝它。
pip install matplotlib-venn
然後我們匯入我們需要的庫。讓我們建立一個名為 items 和 labels 的列表,其中包含兩個標籤。
import matplotlib.pyplot as plot
from matplotlib_venn import venn2, venn2_circles, venn2_unweighted

items = [80, 43, 6]
labels = ["set1", "set2"]
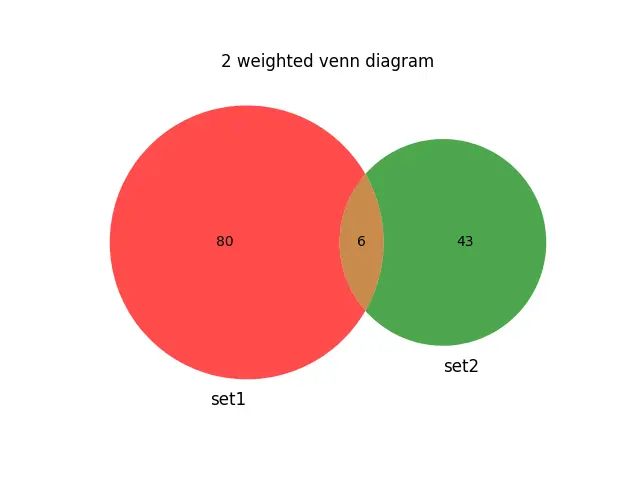
venn2() 函式是生成圓圈的加權圖,其大小取決於我們在此專案列表中給出的值。這個函式有幾個引數。
第一個引數是 subsets,它接受我們在上面建立的傳遞的列表。第二個引數是 set_labels,它接受標籤列表並將其傳遞給 labels 列表。
第三個引數是 set_colors,在這裡我們可以選擇為維恩圖新增顏色,顏色值取決於標籤,所以保持與標籤列表相同的數量。
我們還可以使用 alpha 引數設定透明度。這個引數範圍是 0 到 1,我們可以傳遞 0 到 1 之間的浮點值。
venn2(subsets=items, set_labels=labels, set_colors=("red", "green"), alpha=0.7)
完整程式碼:
import matplotlib.pyplot as plot
from matplotlib_venn import venn2, venn2_circles, venn2_unweighted

items = [80, 43, 6]
labels = ["set1", "set2"]
venn2(subsets=items, set_labels=labels, set_colors=("red", "green"), alpha=0.7)
plot.title("2 weighted venn diagram")
plot.show()
輸出:
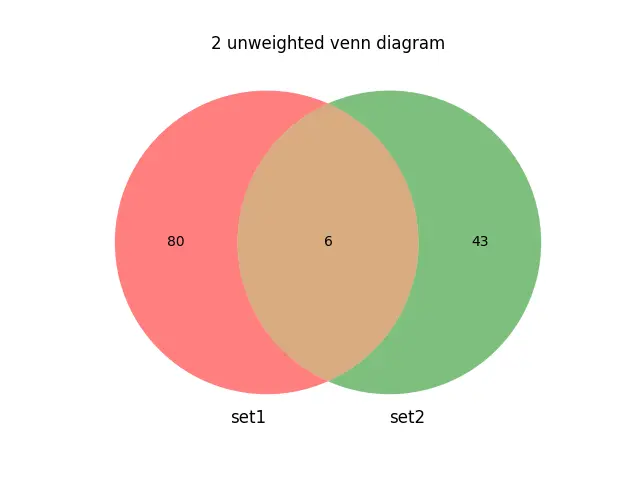
加權維恩圖顯示正面非常小。如果我們想保持兩個維恩圖圓的大小相同,我們可以使用 venn2_unweighted() 函式,它接受與 venn2() 函式相同的引數。
程式碼:
import matplotlib.pyplot as plot
from matplotlib_venn import venn2, venn2_circles, venn2_unweighted

items = [80, 43, 6]
labels = ["set1", "set2"]
venn2_unweighted(
    subsets=items, set_labels=labels, set_colors=("red", "green"), alpha=0.5
)
plot.title("2 unweighted venn diagram")
plot.show()
輸出:
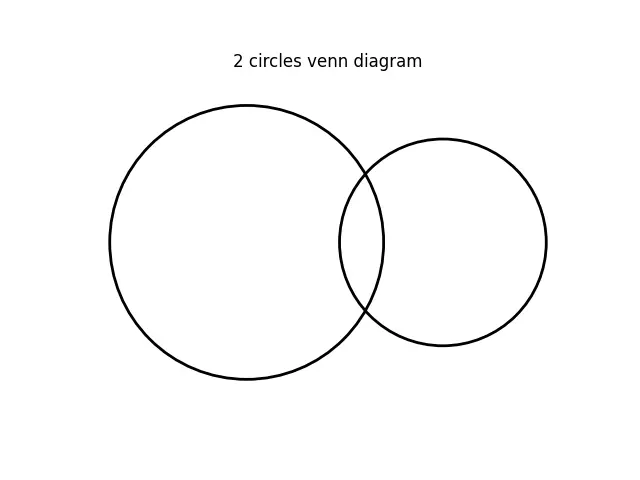
下一個示例使用 venn2_circles() 函式生成空白的兩個圓圈,你無法在其中進一步對此圖進行註釋。此方法不接受 set_labels 和 set_colors 引數。
程式碼:
import matplotlib.pyplot as plot
from matplotlib_venn import venn2, venn2_circles, venn2_unweighted

items = [80, 43, 6]
labels = ["set1", "set2"]
venn2_circles(subsets=items)
plot.title("2 circles venn diagram")
plot.show()
輸出:
現在讓我們繼續討論三圈維恩圖。三圈維恩圖需要三組。
專案應按以下順序輸入。
items=[a,b,ab,c,ac,bc,abc]
讓我們為三個集合和標籤建立一個新的專案列表。
items = [80, 43, 6, 62, 16, 3, 18]
labels = ["set1", "set2", "set3"]
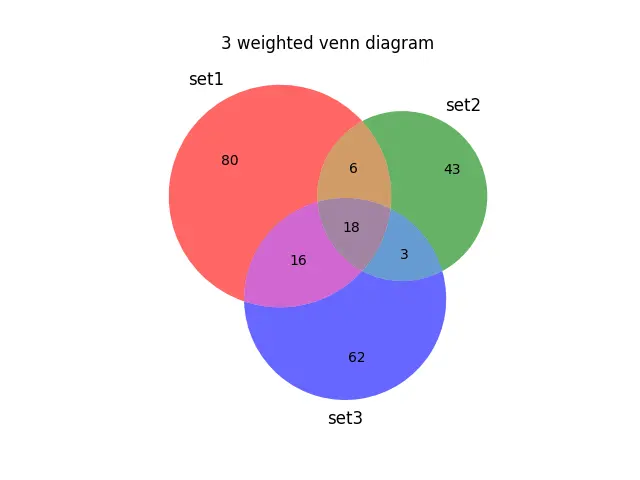
在這三個維恩圖中,我們可以觀察到相交部分。
程式碼:
import matplotlib.pyplot as plot
from matplotlib_venn import venn3, venn3_unweighted

items = [80, 43, 6, 62, 16, 3, 18]
labels = ["set1", "set2", "set3"]

venn3(subsets=items, set_labels=labels, alpha=0.6)
plot.title("3 weighted venn diagram")
plot.show()
輸出:
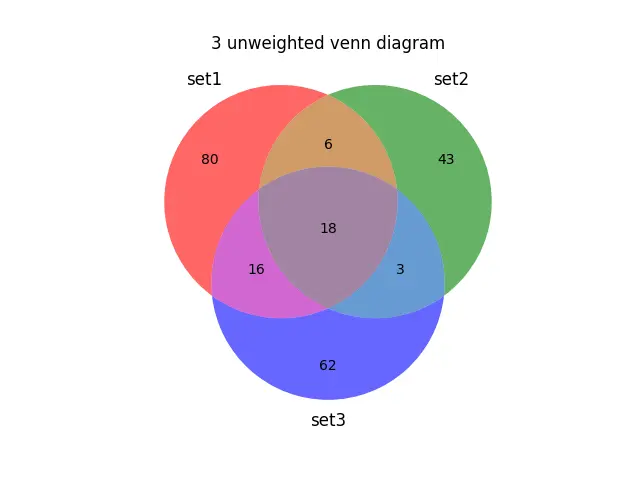
我們還可以使用 venn3_unweighted() 函式建立三個未加權的維恩圖,如下例所示。
程式碼:
import matplotlib.pyplot as plot
from matplotlib_venn import venn3, venn3_unweighted

items = [80, 43, 6, 62, 16, 3, 18]
labels = ["set1", "set2", "set3"]

venn3_unweighted(subsets=items, set_labels=labels, alpha=0.6)
plot.title("3 unweighted venn diagram")

plot.show()
輸出:
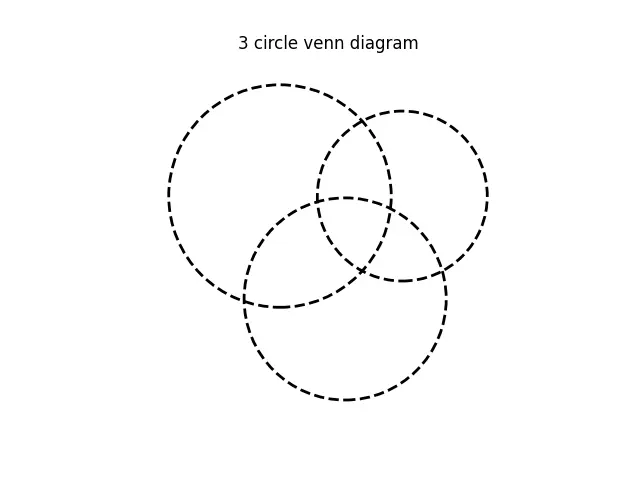
最後,我們可以使用 venn3_circles 函式建立一個三圓圖。
程式碼:
import matplotlib.pyplot as plot
from matplotlib_venn import venn3_circles

items = [80, 43, 6, 62, 16, 3, 18]
labels = ["set1", "set2", "set3"]

venn3_circles(subsets=items, linestyle="dashed")
plot.title("3 circle venn diagram")

plot.show()
輸出:

Hello! I am Salman Bin Mehmood(Baum), a software developer and I help organizations, address complex problems. My expertise lies within back-end, data science and machine learning. I am a lifelong learner, currently working on metaverse, and enrolled in a course building an AI application with python. I love solving problems and developing bug-free software for people. I write content related to python and hot Technologies.
LinkedIn