Matplotlib 中的箭袋圖
Maxim Maeder
2024年2月15日
Matplotlib
Matplotlib Diagram
本教程教你如何使用 Matplotlib 製作箭袋圖。
使用 Matplotlib 建立箭袋圖
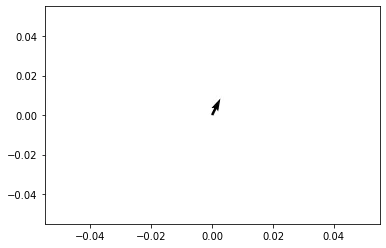
我們需要為 matplotlib.pyplot.quiver 函式提供四個引數來製作圖表。X、Y 軸和 X、Y 向量方向。
x 座標是座標陣列的第一項,第二項是 Y 座標。下一個陣列也是如此,它代表向量。
程式碼:
import matplotlib.pyplot as plt

coordinates = [0, 0]
vector = [1, 2]

plt.quiver(coordinates[0], coordinates[1], vector[0], vector[1])
輸出:
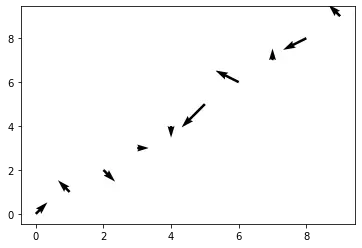
我們還可以製作多個指向不同方向的箭頭。請記住,所有陣列都需要具有相同數量的專案或長度。
程式碼:
import matplotlib.pyplot as plt
from random import randrange

x = [x for x in range(10)]
y = [y for y in range(10)]
vec_x = [randrange(-2, 2) for x in range(10)]
vec_y = [randrange(-2, 2) for x in range(10)]

plt.quiver(x, y, vec_x, vec_y)
輸出:
完整程式碼:
import matplotlib.pyplot as plt
from random import randrange

x = [x for x in range(10)]
y = [y for y in range(10)]
vec_x = [randrange(-2, 2) for x in range(10)]
vec_y = [randrange(-2, 2) for x in range(10)]

plt.quiver(x, y, vec_x, vec_y)
Enjoying our tutorials? Subscribe to DelftStack on YouTube to support us in creating more high-quality video guides. Subscribe
作者: Maxim Maeder

Hi, my name is Maxim Maeder, I am a young programming enthusiast looking to have fun coding and teaching you some things about programming.
GitHub