Python에서 저역 통과 필터 구현

저역 통과 필터는 신호 처리의 기본 중 하나이며 보다 정확한 결과를 얻기 위해 신호를 필터링하는 데 자주 사용되는 용어입니다.
이 자습서에서는 저역 통과 필터와 Python에서 이를 만들고 구현하는 방법에 대해 설명합니다.
저역 통과 필터는 사용자가 지정한 특정 값을 유지하는 차단 주파수보다 낮은 주파수를 갖는 신호를 통과시키는 데 사용됩니다. 차단 주파수 이상의 주파수를 가진 모든 신호는 enervated됩니다.
Scipy를 사용하여 Python에서 저역 통과 버터워스 필터 생성
Python에서는 SciPy 라이브러리의 기능을 활용하여 저역 통과 필터를 생성할 수 있습니다. Scientific Python의 약자인 SciPy는 신호 처리, 최적화 및 통계를 수행하는 기능을 제공하는 데 활용되는 라이브러리입니다. 이 라이브러리는 아래에 있는 NumPy 라이브러리도 사용합니다.
현실 세계에는 몇 가지 저역 통과 필터가 있습니다. 그러나 우리는 Python에서 Butterworth 저역 통과 필터를 만들 것입니다. 이는 통과 대역에 리플이 없음을 의미하는 최대 평면 주파수를 가지기 때문입니다. 이것은 가장 인기 있고 사용되는 저역 통과 필터 중 하나입니다.
파이썬에서 이 방법을 성공적으로 구현하려면 먼저 NumPy, SciPy 및 Matplotlib 모듈을 파이썬 코드로 가져와야 합니다.
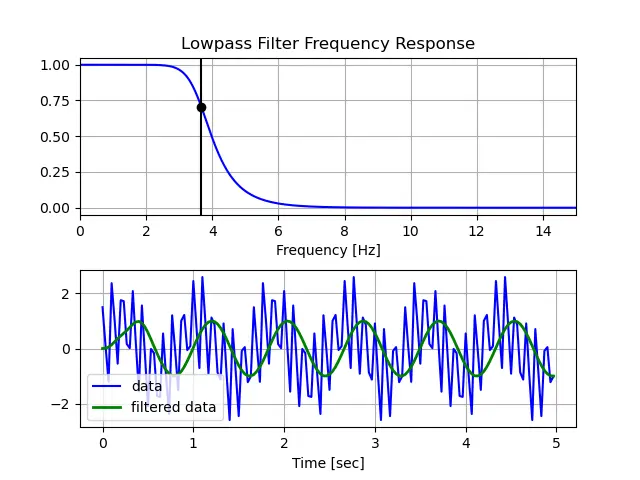
다음 코드는 SciPy 모듈을 사용하여 Python에서 저역 통과 버터워스 필터를 생성합니다.
import numpy as np
from scipy.signal import butter, lfilter, freqz
import matplotlib.pyplot as plt


def butter_lowpass(cutoff, fs, order=5):
    nyq = 0.5 * fs
    normal_cutoff = cutoff / nyq
    b, a = butter(order, normal_cutoff, btype="low", analog=False)
    return b, a


def butter_lowpass_filter(data, cutoff, fs, order=5):
    b, a = butter_lowpass(cutoff, fs, order=order)
    y = lfilter(b, a, data)
    return y


# Setting standard filter requirements.
order = 6
fs = 30.0
cutoff = 3.667

b, a = butter_lowpass(cutoff, fs, order)

# Plotting the frequency response.
w, h = freqz(b, a, worN=8000)
plt.subplot(2, 1, 1)
plt.plot(0.5 * fs * w / np.pi, np.abs(h), "b")
plt.plot(cutoff, 0.5 * np.sqrt(2), "ko")
plt.axvline(cutoff, color="k")
plt.xlim(0, 0.5 * fs)
plt.title("Lowpass Filter Frequency Response")
plt.xlabel("Frequency [Hz]")
plt.grid()


# Creating the data for filteration
T = 5.0  # value taken in seconds
n = int(T * fs)  # indicates total samples
t = np.linspace(0, T, n, endpoint=False)

data = (
    np.sin(1.2 * 2 * np.pi * t)
    + 1.5 * np.cos(9 * 2 * np.pi * t)
    + 0.5 * np.sin(12.0 * 2 * np.pi * t)
)

# Filtering and plotting
y = butter_lowpass_filter(data, cutoff, fs, order)

plt.subplot(2, 1, 2)
plt.plot(t, data, "b-", label="data")
plt.plot(t, y, "g-", linewidth=2, label="filtered data")
plt.xlabel("Time [sec]")
plt.grid()
plt.legend()

plt.subplots_adjust(hspace=0.35)
plt.show()

Vaibhhav is an IT professional who has a strong-hold in Python programming and various projects under his belt. He has an eagerness to discover new things and is a quick learner.
LinkedIn