R의 정규 확률도
Sheeraz Gul
26 mai 2022
R
R Plot
정규 확률도는 데이터의 그래픽 표현입니다. 이 튜토리얼은 R에서 정규 확률을 그리는 방법을 보여줍니다.
R의 정규 확률도
정규 확률도는 주어진 데이터 세트의 정규 분포를 보여줍니다. 데이터 세트를 정규 분포와 비교합니다.
데이터가 정규 분포를 따르는 경우 직선을 보여야 합니다. ggplotr 패키지와 함께 ggplot2를 사용하여 일반 확률 그래프를 그릴 수 있습니다.
우선 다음 패키지를 설치합니다.
install.packages("ggplot2")

install.packages("qqplotr")
패키지가 성공적으로 설치되면 정규 분포에 대한 데이터 세트를 만들고 정규 확률 그래프를 그릴 것입니다. stat_qq_point() 및 stat_qq_line() 함수를 사용하여 정규 확률을 표시합니다.
예를 참조하십시오.
install.packages("ggplot2")
install.packages("qqplotr")
library(ggplot2)
library(qqplotr)
# random data for normal distribution
normal_distribution = rnorm(1000, mean = 110, sd = 60)
# plot the data without line and labels
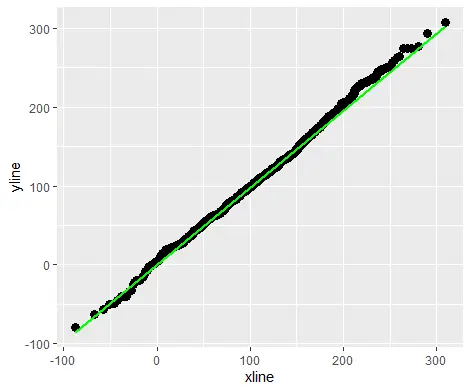
ggplot(mapping = aes(sample = normal_distribution)) + stat_qq_point(size = 3)+ stat_qq_line(color="green")
위의 코드는 주어진 데이터의 정규 확률에 대한 그래프를 녹색 직선으로 표시합니다. 출력 참조:
Vous aimez nos tutoriels ? Abonnez-vous à DelftStack sur YouTube pour nous aider à créer davantage de tutoriels vidéo de haute qualité. Abonnez-vous
Auteur: Sheeraz Gul

Sheeraz is a Doctorate fellow in Computer Science at Northwestern Polytechnical University, Xian, China. He has 7 years of Software Development experience in AI, Web, Database, and Desktop technologies. He writes tutorials in Java, PHP, Python, GoLang, R, etc., to help beginners learn the field of Computer Science.
LinkedIn Facebook