Fórmulas de látex en Matplotlib
Este tutorial explica cómo podemos renderizar las fórmulas o ecuaciones LaTex en Matplotlib.
Escribir fórmulas LaTex en Matplotlib Python
import math
import numpy as np
import matplotlib.pyplot as plt

x = np.linspace(0, 2 * math.pi, 100)
y = np.sin(x)

plt.plot(x, y)
plt.xlabel("x")
plt.ylabel(r"$\sin (x)$")
plt.title("Plot of sinx")
plt.show()
Producción:
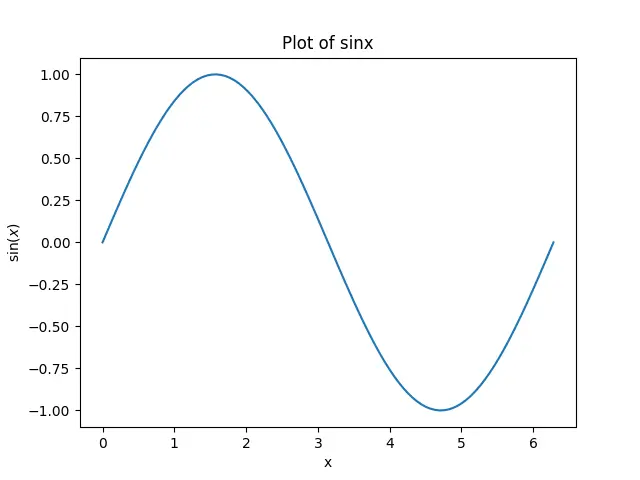
Presentará las fórmulas LaTex en la figura de Matplotlib.
Para mostrar una fórmula LaTex en Matplotlib, debemos poner 'text.usetex' en True. Podemos usar el siguiente script para comprobar el valor de 'text.usetex':
import matplotlib

print(matplotlib.rcParams["text.usetex"])
Producción :
False
Puedes obtener True como salida si 'text.usetex' a True para tu sistema. Si 'text.usetex' está en False, podemos usar el siguiente guión para poner 'text.usetex' en True:
import matplotlib

matplotlib.rcParams["text.usetex"] = True
También necesitamos tener LaTex, dvipng y Ghostscript (versión 9.0 o posterior) para mostrar las fórmulas de LaTex y añadir todas las dependencias de la instalación al PATH.
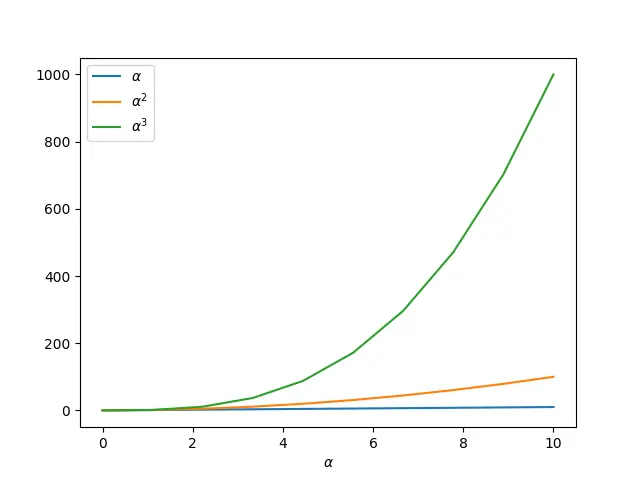
También podemos mostrar los alfabetos griegos y muchos más símbolos en Matplotlib usando el formato Tex.
import numpy as np
import matplotlib.pyplot as plt

alpha = x = np.linspace(0, 10, 10)
y1 = alpha
y2 = alpha ** 2
y3 = alpha ** 3

plt.plot(x, y1, label=r"$\alpha$")
plt.plot(x, y2, label=r"$\alpha^2$")
plt.plot(x, y3, label=r"$\alpha^3$")
plt.xlabel(r"$\alpha$")
plt.legend()
plt.show()
Producción:

Suraj Joshi is a backend software engineer at Matrice.ai.
LinkedIn