scale_fill_continuous in R
Die Methode scale_fill_continuous() stammt aus dem Paket ggplot2. Dieses Tutorial zeigt, wie und wo die Methode scale_fill_continuous() in R verwendet wird.
Scale Fill Continuous in R
Die scale_fill_continuous-Methode ist eine Standardfarbskala für das ggplot2-Paket, wenn die continuous auf die fill abgebildet werden. Die Syntax für diese Methode lautet:
scale_fill_continuous(..., type = getOption("ggplot2.continuous.fill"))
Die Methode verwendet options(), um Standardeinstellungen zu ermitteln. Wobei ggplot2.continuous.fill der Standardwert für die continuous Farbskala ist.
Das Argument für die Methode scale_fill_continuous kann Viridis oder gradient sein. Lassen Sie uns ein Beispiel für diese Methode ausprobieren.
Laden Sie zuerst das Paket ggplot2 und erstellen Sie einen ggplot-Graphen.
library(ggplot2)
DemoGraph <- ggplot(faithfuld, aes(waiting, eruptions, fill = density)) + geom_tile()
DemoGraph

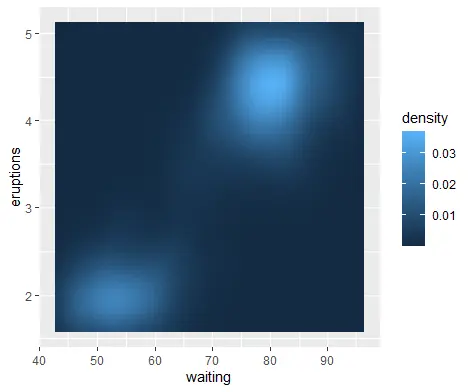
Mit der Methode scale_fill_continuous() können wir dem Graphen nun Muster geben. Siehe Beispiel:
DemoGraph + scale_fill_continuous(type = "gradient")
Der obige Code gibt dem Diagramm ein Gradientenmuster. Siehe Ausgabe:
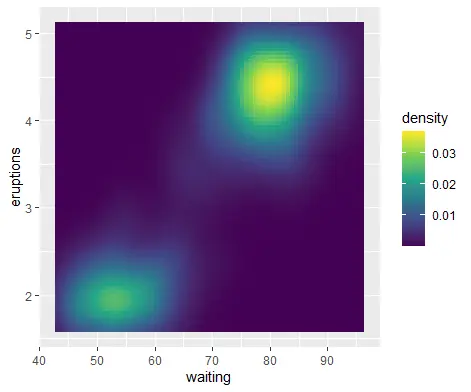
Wir können auch die Option Viridis in der Methode scale_fill_continuous verwenden.
DemoGraph + scale_fill_continuous(type = "viridis")
Der obige Code ergibt das Viridis-Muster und hebt die Punkte des Diagramms hervor. Siehe Ausgabe:
Hier ist der vollständige Code der Einfachheit halber.
library(ggplot2)
DemoGraph <- ggplot(faithfuld, aes(waiting, eruptions, fill = density)) + geom_tile()

DemoGraph

DemoGraph + scale_fill_continuous(type = "gradient")

DemoGraph + scale_fill_continuous(type = "viridis")

Sheeraz is a Doctorate fellow in Computer Science at Northwestern Polytechnical University, Xian, China. He has 7 years of Software Development experience in AI, Web, Database, and Desktop technologies. He writes tutorials in Java, PHP, Python, GoLang, R, etc., to help beginners learn the field of Computer Science.
LinkedIn Facebook