Matplotlib 튜토리얼-축 레이블
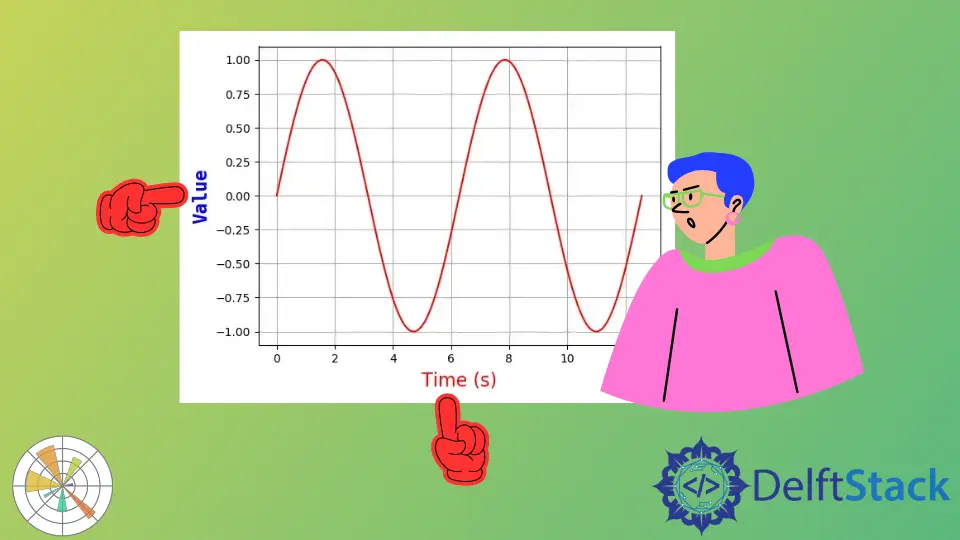
이 튜토리얼에서는 Matplotlib 의 축 레이블, 제목 및 범례에 대해 학습합니다. 이것들은 그래프가 그런 종류의 상황에 대해 설명하는 데 도움이 될 수 있습니다.
Matplotlib 축 레이블
matplotlib.pyplot.xlabel(label, fontdict=None, labelpad=None, **kwargs)
x 축의 레이블을 설정합니다. 마찬가지로 matplotlib.pyplot.ylabel 은 y 축의 레이블을 설정합니다.
** 매개 변수 **
| 이름 | 기술 |
|---|---|
label |
라벨 텍스트 |
fontdict |
가족, 색상, 무게 및 크기와 같은 레이블 텍스트 글꼴 사전 |
labelpad |
레이블과 x 축 사이의 포인트 간격 |
# -*- coding: utf-8 -*-
import numpy as np
import matplotlib.pyplot as plt

x = np.linspace(0, 4 * np.pi, 1000)
y = np.sin(x)

plt.figure(figsize=(4, 3))


plt.plot(x, y, "r")
plt.xlabel("Time (s)", family="serif", color="r", weight="normal", size=16, labelpad=6)

plt.show()
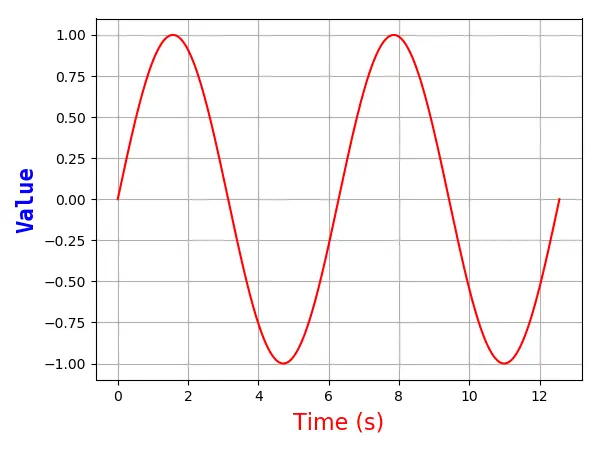
아래에 x 축 레이블을 지정합니다.
plt.xlabel("Time (s)", family="serif", color="r", weight="normal", size=16, labelpad=6)
아래는 자세한 설명입니다.
-
Times (s)
x 축의 레이블 텍스트입니다.
-
family = 'serif'
레이블 텍스트 글꼴 패밀리를 serif 로 지정합니다. [ 'serif'| '산세 리프'| '초급'| '판타지'| '모노 스페이스']
-
color = 'r'
글꼴 텍스트의 색상은 빨간색입니다.
더 많은 색상을 선택하려면 마지막 장의 색상 옵션을 참조하십시오.
-
weight='normal'
레이블 텍스트가 보통 무게를 갖도록 지정합니다.
무게 옵션은
[ 'light', 'normal', 'medium', 'semibold', 'bold', 'heavy', 'black']
-
size = 16
글꼴 크기를 16으로 지정합니다.
-
labelpad = 6
x 축과 레이블 사이의 거리는 6 포인트입니다.

Founder of DelftStack.com. Jinku has worked in the robotics and automotive industries for over 8 years. He sharpened his coding skills when he needed to do the automatic testing, data collection from remote servers and report creation from the endurance test. He is from an electrical/electronics engineering background but has expanded his interest to embedded electronics, embedded programming and front-/back-end programming.
LinkedIn Facebook