Python 中的記憶體分析器
Fariba Laiq
2023年10月10日
Python
Python Memory Profiler
記憶體分析器是監控程式碼塊記憶體消耗的模組。
當它們被建立時,它會顯示變數、物件、函式等所佔用的記憶體量。本文將使用 Memory Profiler 和 guppy 來分析 Python 的記憶體消耗。
在 Python 中使用 Memory Profiler 模組監控記憶體消耗
Memory Profiler 是 Python 中的一個開源模組,它顯示了逐行程式碼分析和每行程式碼消耗的記憶體量。
應該首先使用以下命令安裝它:
#Python 3.x
pip install -U memory_profiler
為了分析程式碼把函式裝飾器@profile 放在函式上面,我們需要分析。
# Python 3.x
from memory_profiler import profile


@profile
def myfunc():
    var_a = [1] * (10 ** 6)
    var_b = [2] * (2 * 10 ** 7)
    del var_b
    del var_a


myfunc()
當我們執行程式碼以顯示記憶體消耗時,我們會將命令列引數 -m memory_profiler 傳遞給 Python 直譯器。
# Python 3.x
python -m memory_profiler filename.py
輸出:
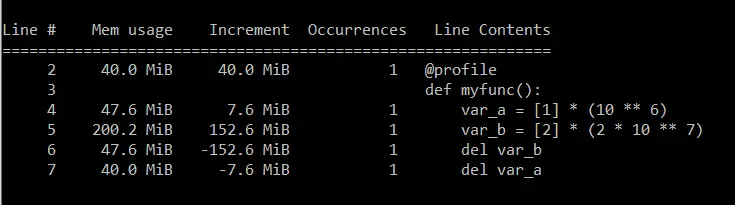
正如我們所見,每行程式碼的行號、記憶體使用和記憶體都會增加。
在 Python 中使用 guppy 模組監控記憶體消耗
guppy 模組簡單易用,可用於記憶體分析。我們將在程式碼中的某個位置為 guppy 編寫程式碼以監控記憶體消耗。
應該首先使用以下命令安裝它:
#Python 3.x
pip install guppy3
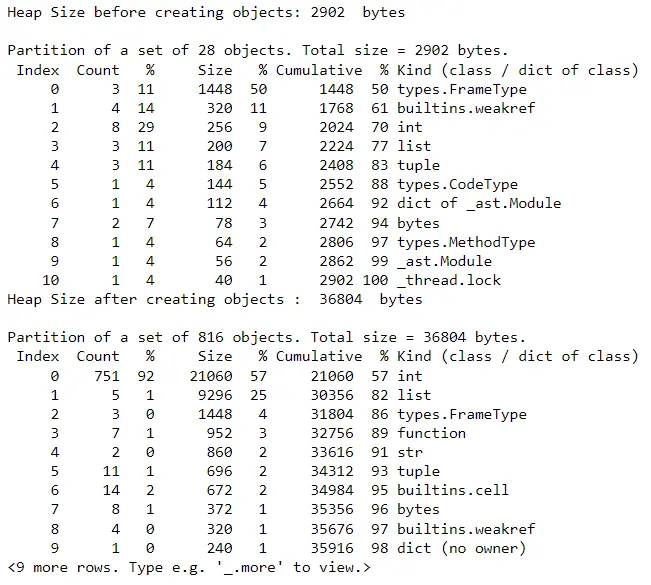
要訪問 Python 的 heapy 物件,我們將呼叫 hpy()。我們將使用 setref() 標記一個參考點來監控記憶體消耗。
為了列印表格,我們將使用我們建立的堆物件呼叫 heap() 函式,並獲取消耗的總位元組數,我們訪問堆狀態的 size 屬性。
# Python 3.x
from guppy import hpy

heap = hpy()
heap.setref()
heap_status1 = heap.heap()
print("Heap Size before creating objects:", heap_status1.size, " bytes\n")
print(heap_status1)
a = []
for i in range(1000):
    a.append(i)
heap_status2 = heap.heap()
print("Heap Size after creating objects : ", heap_status2.size, " bytes\n")
print(heap_status2)
輸出:
Enjoying our tutorials? Subscribe to DelftStack on YouTube to support us in creating more high-quality video guides. Subscribe
作者: Fariba Laiq

I am Fariba Laiq from Pakistan. An android app developer, technical content writer, and coding instructor. Writing has always been one of my passions. I love to learn, implement and convey my knowledge to others.
LinkedIn