How to Create New Figure in Matlab

In this tutorial, we will discuss how to create a new figure using the figure() function in MATLAB.
Create a New Figure Using the figure() Function in MATLAB
If you want to plot data on multiple figures, you can use the figure() function to create a new figure and plot data there. To plot multiple figures using figure(), you just need to define the number of the figure inside this function. For example, let’s plot two variables on two different figures. See the code below.
t = 1:0.01:10;
x1 = sin(2*pi*t);
x2 = sin(2*pi*t - 10);
figure(1)
plot(t,x1,'Color','r')
figure(2)
plot(t,x2,'Color','g')
Output:
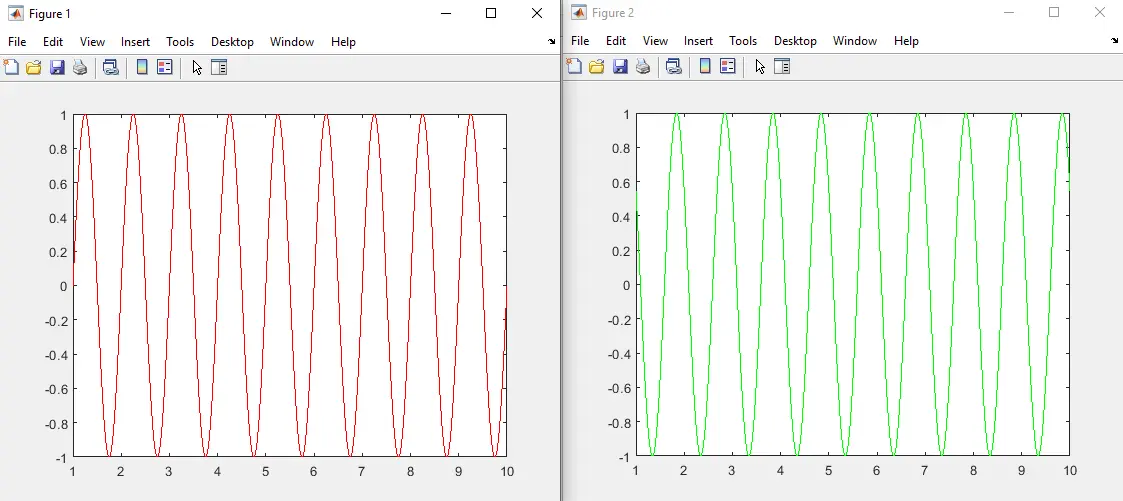
In the above code, we have plotted a sine wave with red color in figure 1 and a sine wave with green color in figure 2. Every plot() function below a figure() will plot the data on the same figure. If you want to plot on a new figure, then you have to create it using the figure() function. You can also give a name to the figure using the Name property. You can change the position of the figure using the Position property, and you can change the units of the figure using the Units property. Check this link for more details about the figure() function.
